Cluster Diagram for Annual Release Goals
RM0400009_22
- Last Update 02/17/2025
- File Size 0.6MB
- # of Slides 2
- File Format PPTX
- Slide Ratio 16:9
- Color
Keywords
- #Content-Based Slides
- #Design-Based Slides
- #Business Vision and Strategy
- #Business Management
- #Diagram
- #Business Strategy
- #Implementation Plan
- #Cluster
- #Chain Diagram
- #16:9
- #cluster diagram PowerPoint
- #annual goals timeline slide
- #milestone visualization template
- #business roadmap presentation
- #year-by-year strategy diagram
About the Product
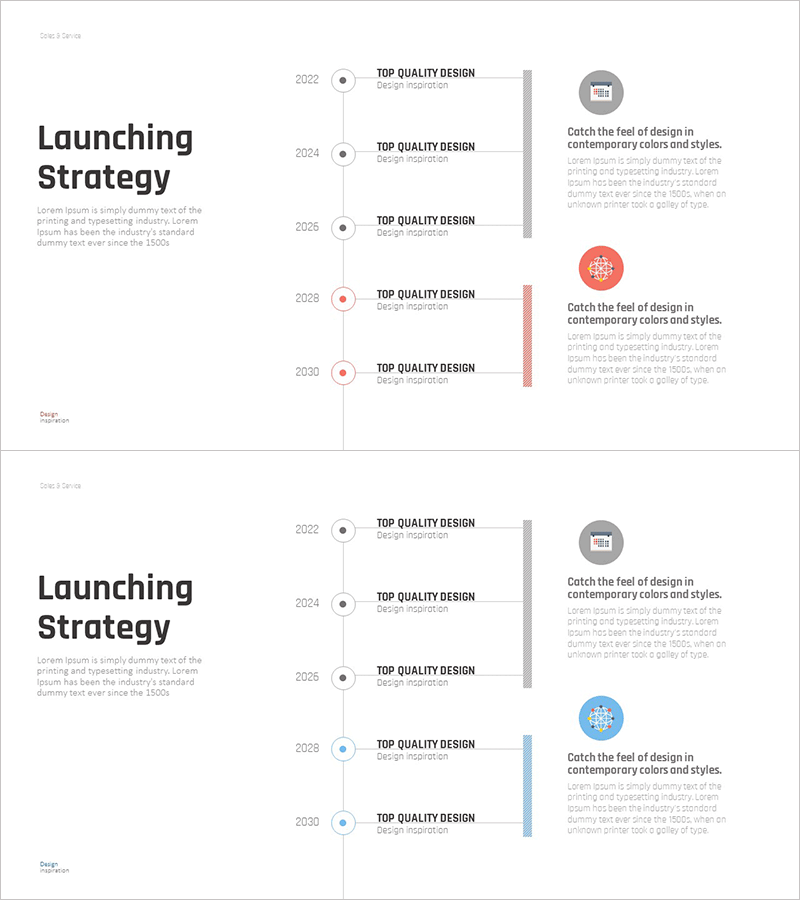
A cluster diagram PowerPoint slide that visualizes annual release goals and strategic milestones. The design features a central vertical timeline with five nodes symmetrically arranged on both sides, enabling clear representation of year-by-year objectives and execution items. Three color schemes—gray, pink, and blue—distinguish priorities and categories, while each node provides independent text input areas for customization. This presentation slide effectively communicates business vision and strategic roadmaps during planning phases, supporting stakeholder alignment and milestone tracking in executive presentations and strategy meetings.
Usage Points
-
Main Usage
Visualizes annual business objectives and product release timelines using a timeline-based cluster diagram to clearly communicate strategic plans and execution roadmaps to stakeholders during planning and implementation phases.
-
How to Use
Enter fiscal years on the central timeline and populate left and right nodes with corresponding annual goals, product launches, and strategic initiatives. Use color coding to distinguish priorities or categories, then incorporate into presentations, strategy meetings, or executive briefings.
-
Recommended For
Business strategists, product managers, and marketing planners use this slide for annual goal setting and roadmap presentations. Suitable for executive reporting, investor presentations, investor relations meetings, and organizational strategy alignment sessions.
-
Slide Structure
A central vertical timeline serves as the anchor, with three nodes on the left and two on the right arranged symmetrically. Each node is rendered as a circular or hexagonal shape with dedicated text input areas. Three color schemes—gray, pink, and blue—are applied to differentiate content categories.
Related Products
-

Traditional Symbols and Key Messages – Diagrams Driving Business Vision and Strategy
#Business Vision and Strategy #Business Management #Diagram
-

Dynamic Triangle Pattern Inclusion Diagram – Business Vision and Strategy
#Business Vision and Strategy #Business Management #Diagram
-

Learning Content Process Diagram – Business Strategy and Implementation Plan
#Business Vision and Strategy #Business Management #Diagram
-

Environmental Protection Diagram Slide – Harmony of Blue and Brown
#Business Vision and Strategy #Diagram #Business Strategy
