Learning Content Process Diagram – Business Strategy and Implementation Plan
RJ0500007_9
- Last Update 06/09/2025
- File Size 1.2MB
- # of Slides 2
- File Format PPTX
- Slide Ratio 16:9
- Color
Keywords
- #Content-Based Slides
- #Design-Based Slides
- #Business Vision and Strategy
- #Business Management
- #Diagram
- #Business Strategy
- #Implementation Plan
- #Cluster
- #Chain Diagram
- #16:9
- #circular process diagram PowerPoint
- #4-step process slide
- #business strategy presentation
- #process flow diagram
- #diagram PowerPoint slide
About the Product
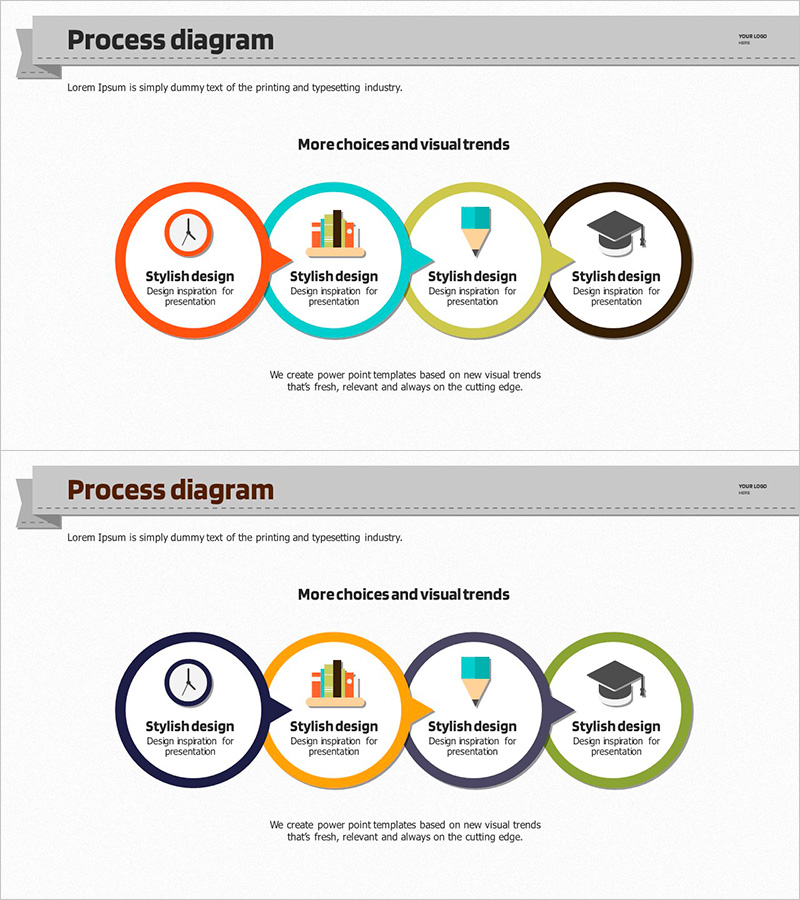
A 4-step circular process diagram PowerPoint slide that visualizes business strategy and implementation planning. Orange, cyan, yellow-green, and brown circular nodes are connected by arrows in a cyclical flow structure, with clock, chart, pen, and graduation cap icons positioned in each stage to intuitively represent key elements of learning content. The 2-slide set (16:9 aspect ratio) is ready to use for presentations requiring process flow, step-by-step progression, and cycle management. Each node's internal text area can be freely edited to adapt to various business scenarios including organizational vision, strategy, execution plans, and performance management.
Usage Points
-
Main Usage
Clearly visualizes a 4-step circular process from business vision to execution plan. Arrows and icons express the role of each stage and their interconnectedness, enabling audiences to understand the entire flow at a glance. Optimized for learning content, business management, and strategy presentation.
-
How to Use
Enter stage titles and descriptions in the text area of each circular node. Icons represent the characteristics of each stage and can be replaced with alternatives if needed. Colors can remain as-is or be changed to match organizational brand colors. Arrow direction indicates time flow or causal relationships.
-
Recommended For
Executives, planning teams, training managers, and project managers use this when explaining business strategy, organizational restructuring, process improvement, and educational program design. Particularly effective for expressing cyclical work processes such as PDCA cycles, continuous improvement, and iterative learning.
-
Slide Structure
2-slide set. Slide 1: Four circular nodes (orange, cyan, yellow-green, brown) connected clockwise in a circular structure with icons (clock, chart, pen, graduation cap) centered in each node. Slide 2: Identical structure with alternative color scheme (navy, orange, purple, green). Text input areas inside each node.
Related Products
-

Cluster Diagram for Annual Release Goals
#Business Vision and Strategy #Business Management #Diagram
-

Dynamic Triangle Pattern Inclusion Diagram – Business Vision and Strategy
#Business Vision and Strategy #Business Management #Diagram
-

Traditional Symbols and Key Messages – Diagrams Driving Business Vision and Strategy
#Business Vision and Strategy #Business Management #Diagram
-

Football Step Diagram – Business Vision and Strategy
#Business Vision and Strategy #Business Strategy #Diagram
