Monthly Sales Plan Schedule - Business and Success
RM0400008_23
- Last Update 02/16/2025
- File Size 0.3MB
- # of Slides 2
- File Format PPTX
- Slide Ratio 16:9
- Color
Keywords
- #Content-Based Slides
- #Design-Based Slides
- #Business Strategy
- #Business Management
- #Diagram
- #Roadmap
- #Execution Plan
- #Cluster
- #Table
- #Closed Cluster Diagram
- #16:9
- #sales plan PowerPoint slide
- #weekly schedule template
- #sales target management chart
- #sales performance PPT
- #business schedule slide
- #sales data visualization PowerPoint
About the Product
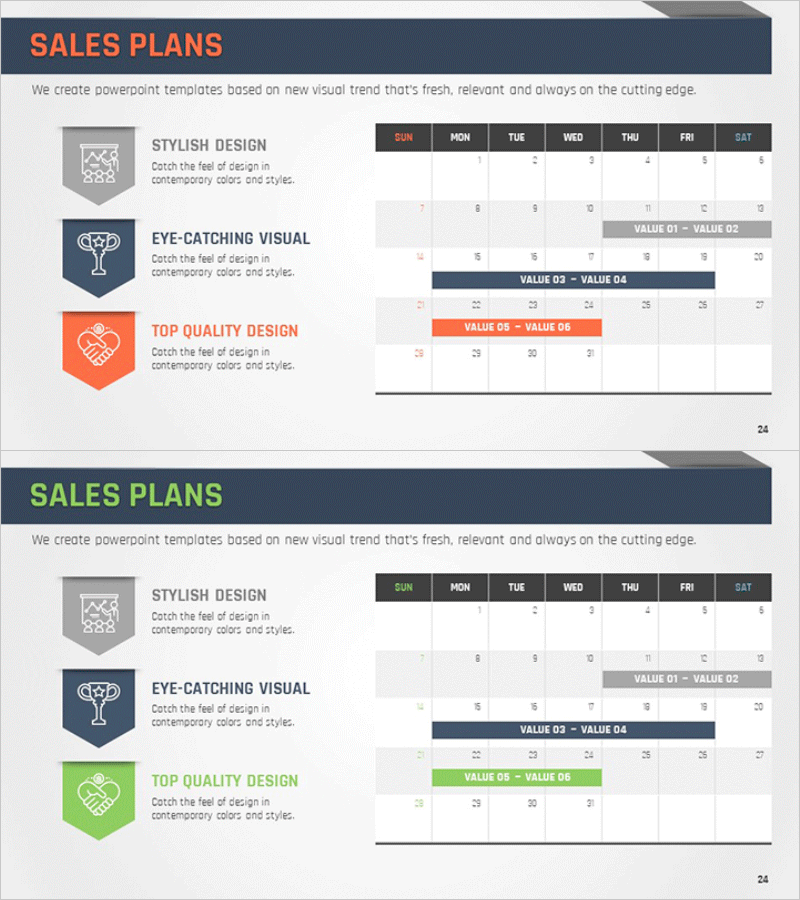
A PowerPoint slide designed to track and manage monthly sales targets on a weekly basis. This presentation template combines a day-of-week sales data input table with color-coded bar charts visualizing key sales metrics (VALUE 01–06). The slide set features three color schemes: dark navy, orange, and green, with each chart optimized for data comparison and performance analysis. Ideal for sales meetings, quarterly performance reports, and business presentations requiring immediate deployment.
Usage Points
-
Main Usage
This slide enables weekly sales goal setting and performance tracking. Input daily sales figures (Sunday–Saturday) and key sales metrics into the data table, then visualize results using color-coded bar charts to assess sales performance at a glance. Suitable for sales team meetings, executive reports, and quarterly performance reviews.
-
How to Use
Enter sales figures for each day of the week in the table section and input corresponding values for each metric (VALUE 01–06). The charts automatically reflect the data entered. Use the color coding (dark navy, orange, green) to distinguish between different sales categories or product lines. Present the slide as-is in sales meetings or update figures as needed for executive briefings and performance reports.
-
Recommended For
Sales team leaders, sales managers, marketing professionals, and executives tracking weekly sales performance and analyzing results. Particularly valuable for retail, distribution, and B2B sales organizations conducting regular performance meetings. Also suitable for quarterly and monthly sales performance reports and strategic planning sessions.
-
Slide Structure
Two-slide set. Slide 1 features a day-of-week (Sunday–Saturday) sales data input table paired with 3-metric bar charts in dark navy and orange. Slide 2 displays metrics VALUE 03–06 in green bar charts, enabling comparative analysis of additional sales indicators across the week.
Related Products
-

Business Promotion Schedule Roadmap – Strategy and Management
#Business Strategy #Business Management #Diagram
-

2-Month Schedule Table – Business Promotion Strategy
#Business Strategy #Diagram #Step-by-Step Schedule Plan
-

Key Events Roadmap – Business Strategy and Diagram Utilization
#Business Strategy #Business Management #Diagram
-

Monthly Schedule Roadmap – Effective Business Execution Strategy
#Business Strategy #Diagram #Step-by-Step Schedule Plan
