Effectiveness Analysis Plan Circular Diagram – Ideal for Business Management
RM0400007_32
- Last Update 02/16/2025
- File Size 0.4MB
- # of Slides 2
- File Format PPTX
- Slide Ratio 16:9
- Color
Keywords
- #Content-Based Slides
- #Design-Based Slides
- #Business Management
- #Operational Plan
- #Diagram
- #Implementation Schedule
- #Project Implementation Schedule
- #Spread
- #Decentralized Diagram
- #16:9
- #radial diagram PowerPoint
- #effectiveness analysis presentation slide
- #5-stage diagram template
- #business management PPT
- #operational planning slide
About the Product
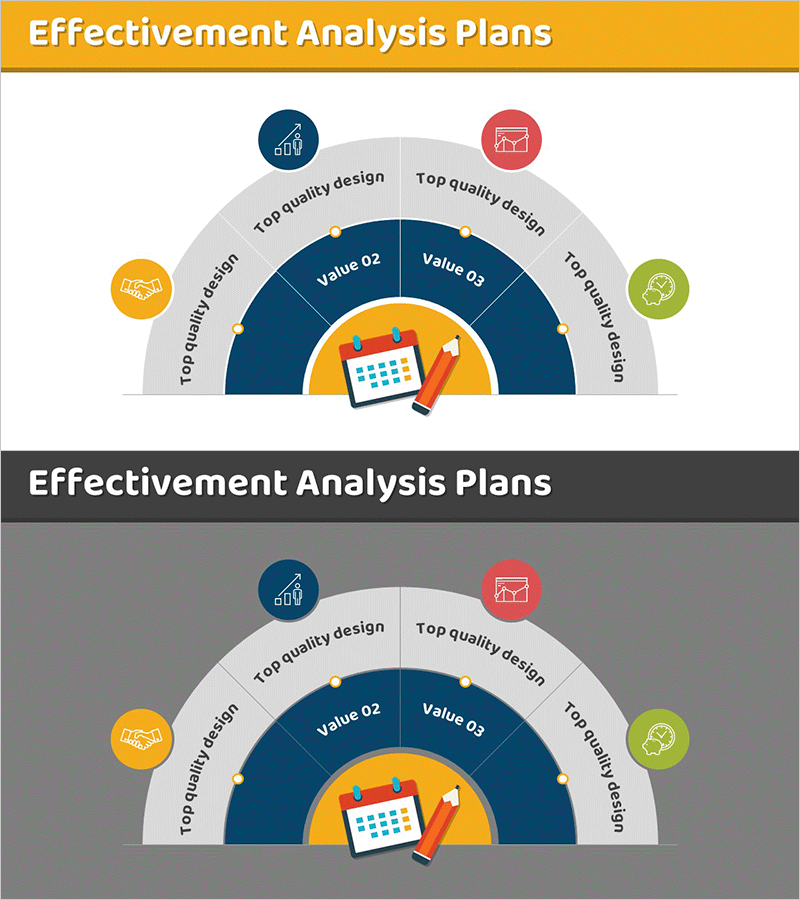
A radial diagram PowerPoint slide optimized for business management and operational planning presentations. Five nodes radiate outward from a central planning icon, visually representing key effectiveness analysis elements including quality design, performance design, reliability design, and value assessment. The two-tone color scheme combining a gold header with a dark navy interior conveys professionalism, while individual icons for each stage—chart, report, checkmark, collaboration, and idea—facilitate intuitive understanding. The 2-slide set includes both light and dark background versions, enabling seamless adaptation to various presentation environments and display settings.
Usage Points
-
Main Usage
Simultaneously visualizes five core effectiveness analysis elements in business management and operational planning presentations, clearly communicating relationships and priorities among stages. The center-to-periphery structure illustrates the flow from core objectives to detailed execution items.
-
How to Use
Edit node text labels to reflect your organization's specific effectiveness analysis categories, and customize icons as needed to match presentation context. Use the light background version in standard conference rooms and the dark background version in dark-theme presentation environments for optimal readability.
-
Recommended For
Ideal for business managers, operations officers, strategic planning teams, consultants, and project leaders reporting effectiveness analysis results to executives and stakeholders. Particularly effective when explaining multi-stage evaluation systems or quality management processes.
-
Slide Structure
A central planning icon is surrounded by five circular nodes arranged clockwise around it. Each node contains a unique colored icon and text label, with connecting lines from the center to each node representing hierarchical relationships. An outer arc background visually delineates the five stages.
Related Products
-

Icon Box Roadmap Slide – Three-Stage Milestone PowerPoint
#Business Strategy #Business Management #Operational Plan
-

Detailed Business Operation Plan Slide – Schedule and Column Text
#Business Management #Operational Plan #Diagram
-

Future Planning Schedule – Business Execution Timeline Visualization
#Business Management #Operational Plan #Diagram
-

Business Detail Calendar – Diagram for Efficient Schedule Management
#Business Management #Operational Plan #Diagram
