Sales Plan Slide for Business Management and Marketing Strategy
RM0400006_23
- Last Update 02/16/2025
- File Size 0.9MB
- # of Slides 2
- File Format PPTX
- Slide Ratio 16:9
- Color
Keywords
- #Content-Based Slides
- #Design-Based Slides
- #Business Management
- #Marketing Plan and Strategy
- #Diagram
- #Execution Plan
- #Pricing Strategy
- #Cluster
- #Combination Diagram
- #Chain Diagram
- #16:9
- #timeline diagram PowerPoint
- #sales plan slide
- #project milestone presentation
- #4-phase schedule template
- #sales timeline PPT slide
- #business management PowerPoint
- #how to create timeline in PowerPoint
About the Product
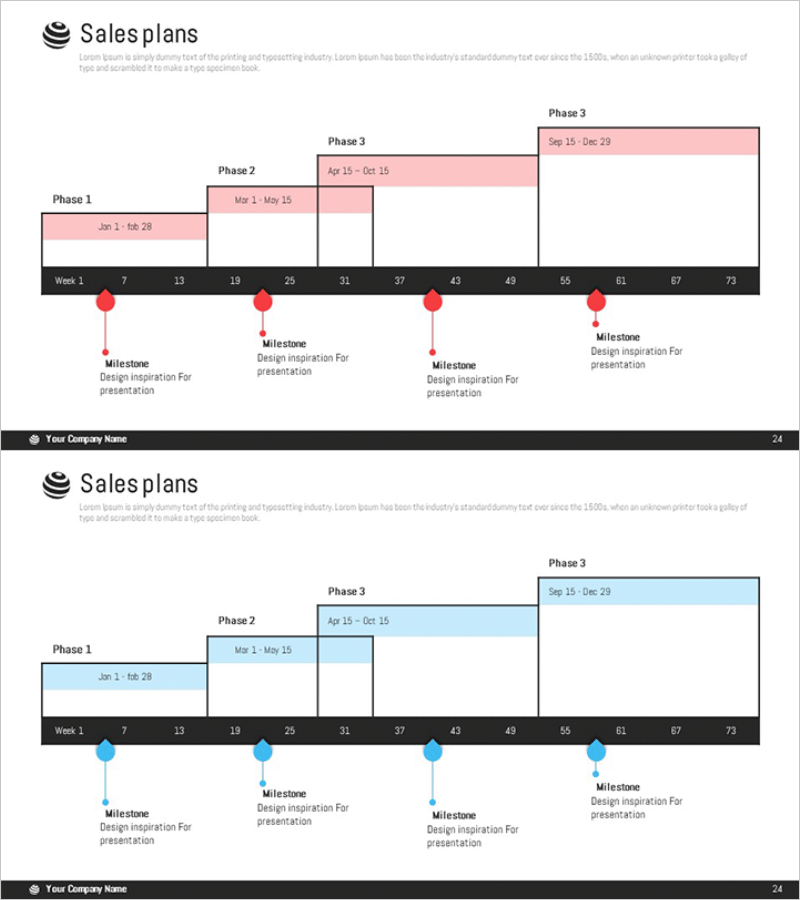
A professional sales plan PowerPoint slide designed for business management and marketing strategy presentations. This slide features a linear timeline diagram with four distinct phases positioned along a time axis, enabling stakeholders to grasp each phase's duration, objectives, and progress at a glance. The design uses pink and blue color coding to differentiate phases, with circular milestone markers and connecting lines that clearly illustrate project progression flow. Comprising 2 slides, this presentation template is ready for immediate use in sales scheduling, project management, and strategic planning presentations.
Usage Points
-
Main Usage
Visualizes sales planning, project timelines, and marketing strategy implementation processes using a time-axis-based timeline, enhancing comprehension and clearly communicating phase-specific milestones and objectives to stakeholders.
-
How to Use
Input project names, date ranges, and key objectives for each of the four phases, then add descriptive text below each milestone marker. Colors, date ranges, and phase quantities are fully editable and customizable to your specific needs.
-
Recommended For
Sales managers, marketing professionals, project coordinators, business planning presentations, quarterly and annual sales strategy meetings, investor pitch decks, team project timeline sharing, and executive progress reports.
-
Slide Structure
Title area at top, central time axis spanning Week 1 to 73, four color-coded phase boxes (Jan 1-Feb 28, Mar 1-May 15, Apr 15-Oct 15, Sep 15-Dec 29), four circular milestone markers positioned below each phase, and descriptive text areas for milestone details.
Related Products
-

Key Sales Strategy – Effective Marketing Plan
#Marketing Plan and Strategy #Financial Plans and Performance #Diagram
-

Step-by-step New Product Launch and Marketing Strategy Template
#Business Strategy #Marketing Plan and Strategy #Diagram
-

Central Diffusion Diagram for Business Strategy Visualization – Enhancing Marketing Efficiency
#Business Introduction #Marketing Plan and Strategy #Diagram
-

Business Area Circular Hexagon Diagram
#Business Introduction #Marketing Plan and Strategy #Diagram
