Marketing Budget Summary Table Slide – Efficient Data Management
RM0400004_26
- Last Update 02/15/2025
- File Size 2MB
- # of Slides 2
- File Format PPTX
- Slide Ratio 16:9
- Color
Keywords
About the Product
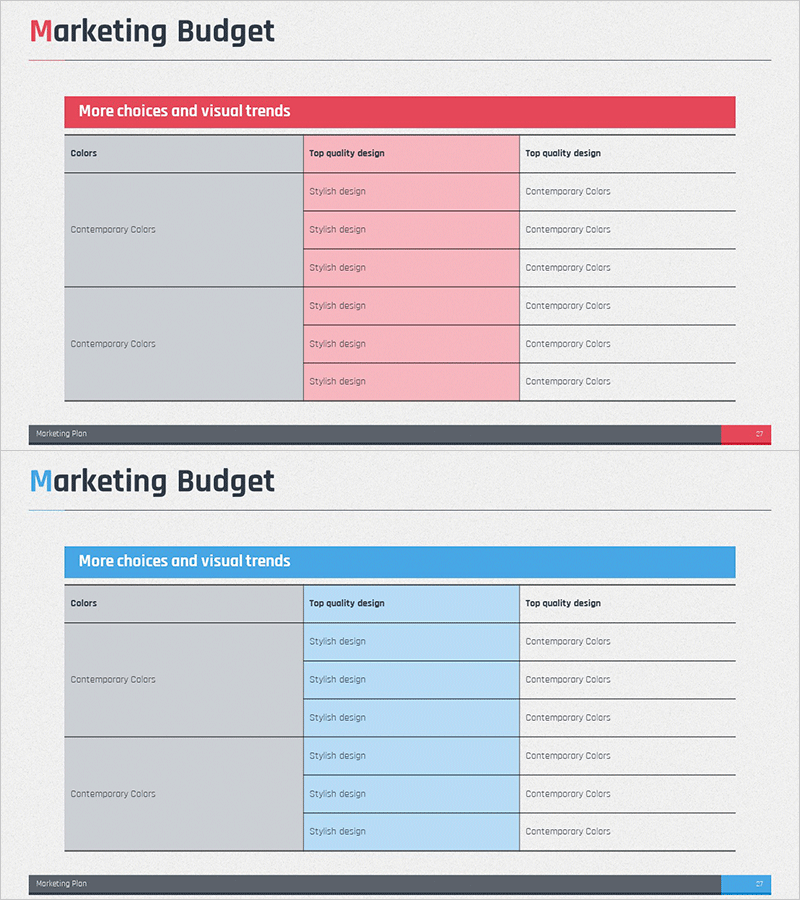
A structured table-based PowerPoint slide for presenting marketing budget allocation and cost management. This slide deck features two color versions—pink and blue—each with a 6-row, 3-column table layout that clearly displays budget categories, descriptions, and amounts side by side. The gray header row and color-coded data sections create visual hierarchy, making budget comparison and financial analysis immediately accessible. Perfect for marketing managers, finance teams, and executives presenting quarterly budget reviews, campaign spending, or resource allocation in professional presentations.
Usage Points
-
Main Usage
Presents marketing department budget status, allocation, and cost management in visual format for stakeholders. The table structure enables simultaneous display of budget items, descriptions, and figures, supporting data comparison and executive decision-making.
-
How to Use
Enter marketing channels (digital, offline, events, etc.) in each row and input corresponding budget amounts, spending rates, and KPIs. Use the pink version for warm-toned presentations and blue version for trust-focused reports. All text and colors are fully editable to match your brand guidelines.
-
Recommended For
Marketing managers, marketing directors, CFOs, and executives presenting budget reports, quarterly performance reviews, and marketing strategy meetings. Ideal for organizing advertising spend, content production costs, event budgets, and personnel expenses across multiple marketing initiatives.
-
Slide Structure
Two-slide set featuring identical table layouts in contrasting colors. First slide displays pink-background table (6 rows × 3 columns), second slide shows blue-background version. Each table includes gray header row and five data rows, with left column for categories and right two columns for descriptions and numerical values, optimizing readability and data comparison.
Related Products
-

PowerPoint Template for Service Operation Strategy Presentation
#Business Management #Operational Plan #Technical Approach
-

Systemic Flow Layered Structure - Visualizing Business Strategy
#Business Strategy #Diagram #Step-by-Step Schedule Plan
-

Program Composition Diagram – Product and Service Introduction
#Product/Service Introduction #Diagram #Composition
-

Funding Plan Table – Efficient Fund Management
#Marketing Plan and Strategy #Financial Plans and Performance #Diagram
