Vision and Goals Introduction Diagram – Objective Setting and Vision Sharing
RM0400004_14
- Last Update 02/15/2025
- File Size 2MB
- # of Slides 2
- File Format PPTX
- Slide Ratio 16:9
- Color
Keywords
- #Content-Based Slides
- #Design-Based Slides
- #Company Introduction
- #Business Vision and Strategy
- #Diagram
- #Core Values, Vision, and Mission
- #Business Vision
- #Spread
- #Radial Diagram
- #16:9
- #radial diagram PowerPoint
- #vision and goals slide template
- #strategic objective diagram
- #how to create vision diagram in PowerPoint
- #business strategy presentation slide
About the Product
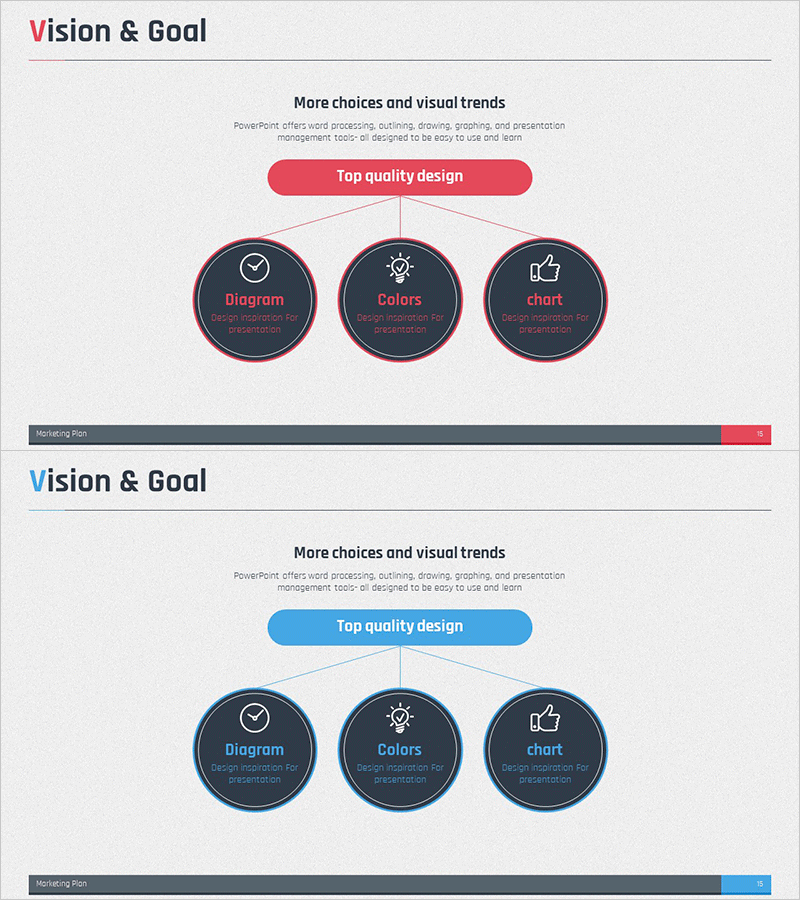
A radial diagram PowerPoint slide where the central objective branches into three strategic divisions. Featuring a dark navy background with pink and blue accent colors, this design is optimized for vision-sharing and objective-setting presentations. Each division includes icons (checkmark, lightbulb, thumbs-up) and circular nodes to visually represent organizational core strategies. The 2-slide set is ready to use in marketing planning, strategy presentations, and executive briefings, with fully editable text and color elements.
Usage Points
-
Main Usage
Visualizes how an organization's core vision branches into three strategic divisions. Effectively communicates direction during objective setting, vision sharing, and strategy planning phases. Ideal for executive briefings, team meetings, and investor pitches to clearly articulate organizational direction and strategic priorities.
-
How to Use
The 2-slide structure introduces the complete vision and goal framework on the first slide, then details each strategic division on the second. Replace the central button text with your organizational objective and update the three circular nodes with your strategic division names to create a customized presentation.
-
Recommended For
Executives, planning teams, marketing managers, and strategy leads presenting organizational vision and objectives. Fits seamlessly into business plans, marketing strategies, strategic reports, and investor pitch decks—particularly in vision and objective sections. Enhances core message delivery in team meetings and executive presentations.
-
Slide Structure
Radial layout with a central pink rounded button (Top quality design) connecting to three dark navy circular nodes (Diagram, Colors, Chart). Each node contains an icon (checkmark, lightbulb, thumbs-up) and text area. Bottom progress bar shows marketing plan status. 16:9 aspect ratio, 2-slide set.
Related Products
-

Core Values Vision and Mission Diagram – Visualizing Organizational Goals
#Company Introduction #Business Vision and Strategy #Diagram
-

Vision & Goals & Core Competency Diagram – Integrated Vision Presentation
#Company Introduction #Business Vision and Strategy #Diagram
-

Global Corporate Vision and Goals Diagram
#Company Introduction #Business Vision and Strategy #Diagram
-

Goal Achievement Diagram – Vision and Strategy Setup
#Business Vision and Strategy #Diagram #Business Vision
