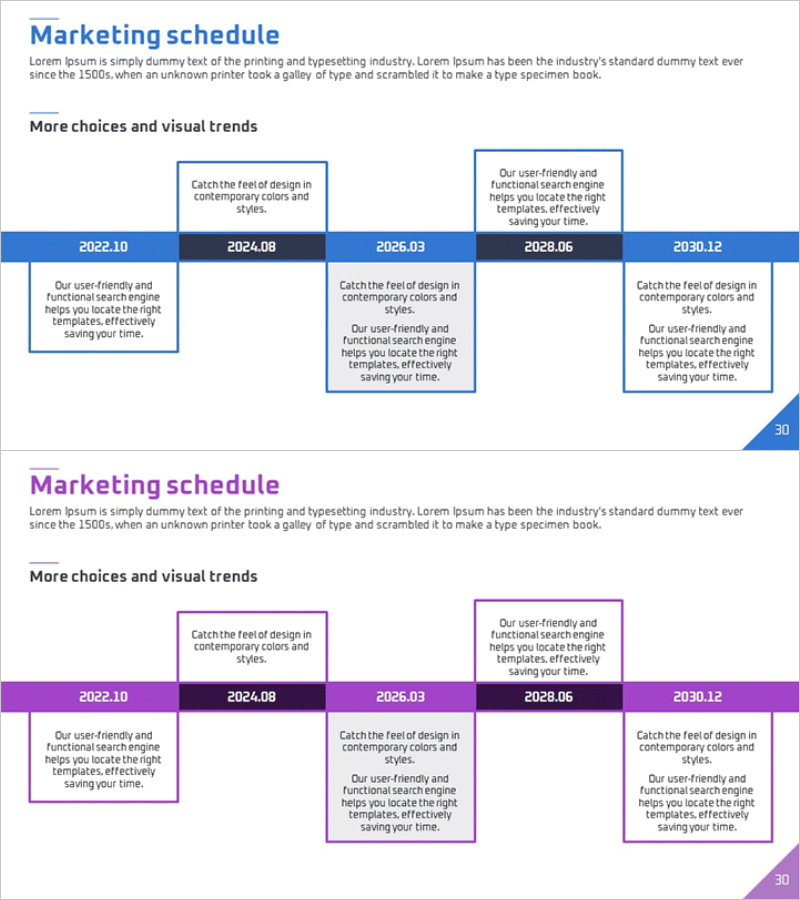
Annual Marketing Schedule Diagram
RM0400002_29
- Last Update 02/14/2025
- File Size 1MB
- # of Slides 2
- File Format PPTX
- Slide Ratio 16:9
- Color
Keywords
About the Product
A timeline diagram PowerPoint slide that visualizes annual marketing plans and strategic roadmaps. This 2-slide template features blue and purple color themes with a 5-stage horizontal timeline spanning from 2022.10 to 2030.12. Each timeline node includes editable text boxes for marketing strategies, campaign names, and key initiatives. The layout combines upper highlight boxes for key messages, a central timeline axis, and lower detail sections for implementation specifics. Ideal for marketing presentations, strategic planning documents, and executive reports to communicate long-term marketing direction and quarterly milestones effectively.
Usage Points
-
Main Usage
Visualize multi-year marketing strategies and annual execution plans in timeline format to enhance stakeholder understanding and facilitate strategic alignment. Serves as a core visual tool in marketing plans, business reports, and executive presentations to communicate long-term direction and quarterly objectives.
-
How to Use
Enter marketing strategies, campaign names, and annual targets in the text boxes above each timeline node. Use upper highlight boxes for key messages or industry trends, and lower detail sections for specific execution plans, budgets, and responsible departments. This layered structure supports comprehensive information delivery.
-
Recommended For
Marketing managers, planning teams, executives, and business development professionals preparing annual marketing roadmaps and strategic plans. Recommended for quarterly marketing strategy meetings, executive briefings, investor presentations, and marketing planning documents.
-
Slide Structure
2-slide template: Blue theme slide with 3 upper highlight boxes, 5-stage horizontal timeline axis with year labels (2022.10–2030.12), and 3 lower detail sections; Purple theme slide with identical structure. Timeline nodes are connected by arrows and lines in a linear flow pattern with editable text input areas.
Related Products
-

Detailed Diagram for an Effective Strategy
#Business Vision and Strategy #Technical Approach #Diagram
-

Business Area Linkage Overlay Diagram
#Company Introduction #Business Vision and Strategy #Diagram
-

Technology Status Diffusion Diagram - Concisely Centered
#Product/Service Introduction #Business Introduction #Diagram
-

Final Marketing Goals According to Users
#Marketing Plan and Strategy #Diagram #Marketing Objectives
