Area Diagram of Data Analysis – Visualizing Business Strategies
RJ0500041_25
- Last Update 06/18/2025
- File Size 0.3MB
- # of Slides 2
- File Format PPTX
- Slide Ratio 16:9
- Color
Keywords
- #Content-Based Slides
- #Design-Based Slides
- #Business Introduction
- #Business Vision and Strategy
- #Diagram
- #Business Areas
- #Business Strategy
- #Spread
- #Decentralized Diagram
- #16:9
- #cluster diagram PowerPoint
- #data analysis presentation slide
- #4-area diagram
- #business strategy visualization
- #area classification PPT slide
About the Product
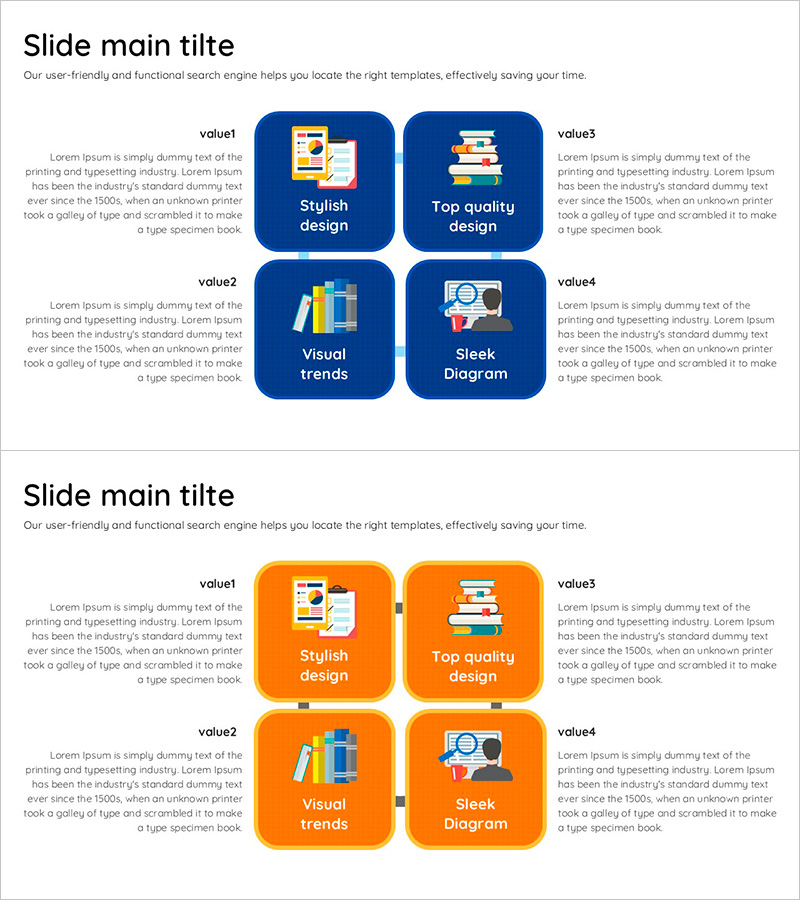
A cluster diagram PowerPoint slide that divides data analysis areas into four distinct sections. Featuring a dark blue background with orange accent boxes, this slide clearly represents each area using icons and text to visualize information hierarchy. Ideal for business strategy, corporate vision, and data analysis presentations where you need to distinguish and explain key areas. The 2-slide set provides multiple color variations (blue and orange) in 16:9 widescreen PPTX format, ready for immediate editing and customization.
Usage Points
-
Main Usage
Visualize data analysis results by classifying them into four major areas, supporting business strategy development. The diagram enables stakeholders to understand area characteristics and relationships at a glance, making it ideal for presenting corporate vision and emphasizing key elements during strategy formulation.
-
How to Use
Enter your data analysis items, strategy elements, or business objectives into each of the four box areas. Replace text and icons to match your presentation content, and use the color variation slides to enhance emphasis across different sections of your presentation.
-
Recommended For
Perfect for data analysts, business strategy managers, executives preparing reports, and marketing planners. Effectively communicate complex data in business plans, strategy reports, investor presentations, and executive meetings by structuring information into four distinct areas.
-
Slide Structure
Two-slide set featuring dark blue and orange background versions. Each slide displays four rounded rectangular boxes arranged centrally to represent the four areas, with space for icons, titles, and descriptive text in each box. Optimized for 16:9 widescreen format to suit modern presentation environments.
Related Products
-

Global Business Activity Areas Diagram - Center of Business Vision and Strategy
#Business Introduction #Business Vision and Strategy #Diagram
-

Academic Icons and Centerless Diffusion Diagram – Innovative Business Strategy
#Business Introduction #Business Vision and Strategy #Diagram
-

Market Share Donut Pie Chart – Business Strategy and Vision
#Business Introduction #Business Vision and Strategy #Diagram
-

Business Goal Icon Diagram – An Effective Tool for Communicating Business Vision
#Business Introduction #Business Vision and Strategy #Diagram
