Competitor Analysis Area Graph – Business Vision and Strategy
RM0300014_10
- Last Update 02/10/2025
- File Size 2.7MB
- # of Slides 2
- File Format PPTX
- Slide Ratio 16:9
- Color
Keywords
- #Content-Based Slides
- #Design-Based Slides
- #Company Introduction
- #Business Vision and Strategy
- #Diagram
- #History
- #Business Vision
- #Cluster
- #Closed Cluster Diagram
- #16:9
- #area graph PowerPoint
- #competitor analysis presentation
- #area chart slide template
- #business strategy PPT
- #vision strategy slide deck
About the Product
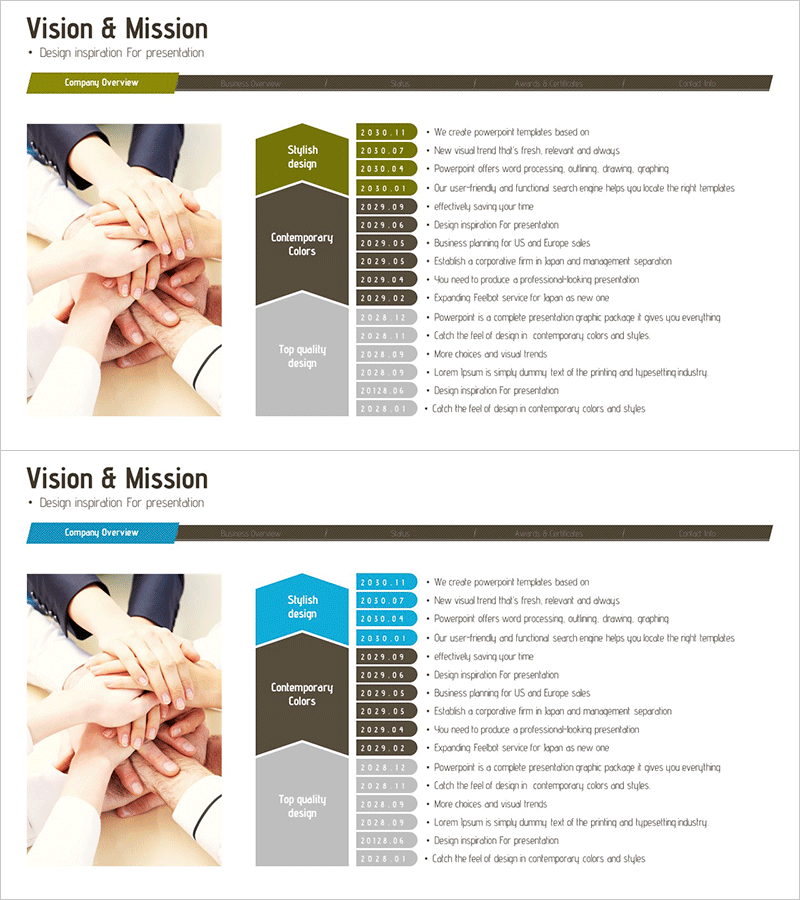
A PowerPoint slide deck visualizing competitor analysis and business vision and strategy using a two-layer area graph in olive green and brown tones. The area chart intuitively expresses competitive positioning and market share, paired with a team collaboration image to communicate the organization's vision, mission, and strategic direction at a glance. This 16:9 widescreen 2-slide presentation is ready to edit and use immediately, making it ideal for business strategy presentations, executive briefings, and investor pitch decks.
Usage Points
-
Main Usage
Visualize competitive positioning and market share using an area chart while communicating the organization's vision, mission, and strategic direction. The team collaboration image reinforces trust and cooperation, making it effective for clearly expressing strategic direction to stakeholders.
-
How to Use
Use in business strategy presentations during the competitive environment analysis section to explain competitor positioning, followed by your company's vision, mission, and strategy. Ideal for executive briefings, investor pitch decks, and strategic planning meetings to communicate market conditions and corporate direction simultaneously.
-
Recommended For
Strategy planning teams, executives, business development managers, marketing leaders, and investor relations professionals presenting competitive analysis results and business strategy to internal and external stakeholders. Particularly suited for board meetings, investor pitches, and strategic planning workshops.
-
Slide Structure
Two-slide layout featuring the first slide with an olive green area graph, team collaboration image, and text boxes for competitor analysis information. The second slide displays a brown-toned area chart with vision, mission, and strategy items listed, emphasizing data-driven decision-making.
Related Products
-

Marketing Goals Plan Diagram - Strategies for Business Success
#Business Vision and Strategy #Marketing Plan and Strategy #Diagram
-

History of Barista Template – Engaging Business Story
#Company Introduction #Diagram #History
-

Corporate Philosophy and Vision Strategy Diagram – Emphasizing Vision and Core Values
#Company Introduction #Business Vision and Strategy #Diagram
-

Research and Development Area Diagram – Vision of Innovation
#Company Introduction #Business Vision and Strategy #Diagram
