List of Key Partners – Visualizing Client Success Stories with a Cluster Diagram
RM0300007_18
- Last Update 02/08/2025
- File Size 1.1MB
- # of Slides 2
- File Format PPTX
- Slide Ratio 16:9
- Color
Keywords
- #Content-Based Slides
- #Design-Based Slides
- #Customer Success Stories
- #Diagram
- #Introduction of Key Customers
- #Cluster
- #Closed Cluster Diagram
- #16:9
- #cluster diagram PowerPoint
- #partner network visualization slide
- #relationship diagram PPT
- #closed-form cluster template
- #business presentation slide design
About the Product
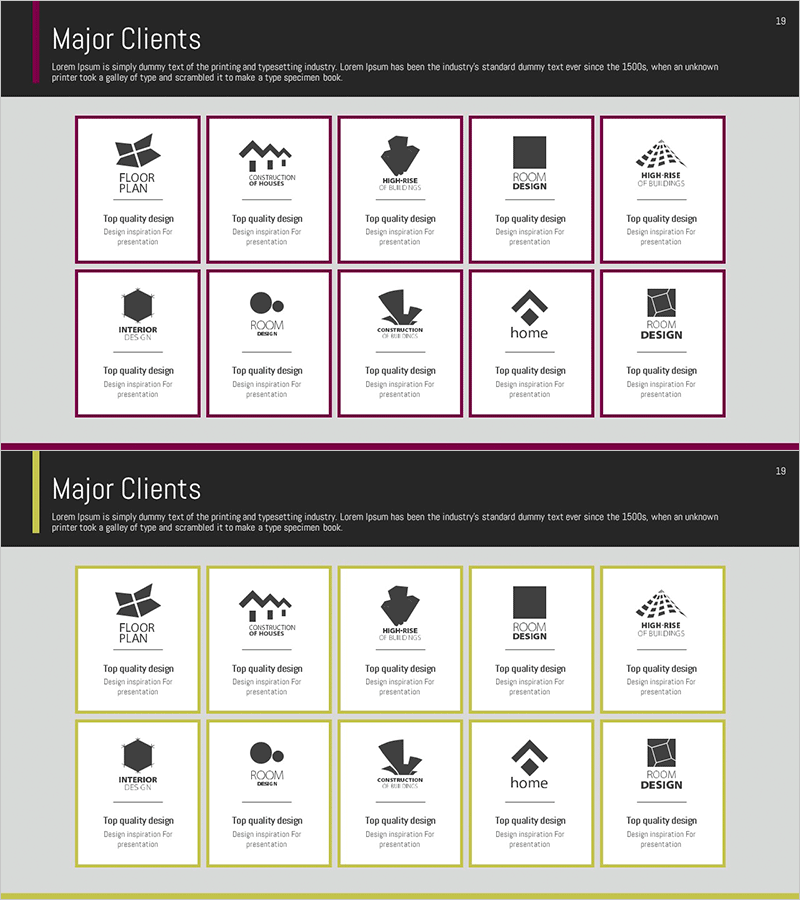
A PowerPoint slide that visualizes key partner companies and client success stories using a closed-form cluster structure. Ten nodes are arranged in a circular pattern around a central element, intuitively representing relationships and connectivity. The magenta border and white background create clear visual separation for each item, making it ready for immediate presentation use. The 2-slide set accommodates multiple data scenarios and is optimized for 16:9 widescreen format.
Usage Points
-
Main Usage
Represents an organization's key partners, partner ecosystem, and customer portfolio using a centralized cluster structure that emphasizes relationships and mutual connectivity. Effectively communicates network scale and credibility in company profiles, business reports, and investor pitch decks.
-
How to Use
Enter the core message (company name, core value) in the central circular area and add partner names, client names, or success case descriptions to the 10 surrounding nodes. Adjust node size or color based on data importance to create visual emphasis.
-
Recommended For
Executives, sales teams, and marketing professionals explaining partnership status, customer portfolios, and ecosystem composition. Ideal for startup investment pitches, corporate partner introductions, and consulting firm client network presentations.
-
Slide Structure
2-slide set. Each slide features one central circular node surrounded by 10 nodes in a closed-form arrangement, separated by magenta borders. Optimized for 16:9 widescreen format with clearly defined text input areas for easy customization.
Related Products
-

Target Settings Rounding Diagram – Customer Analysis and Success Cases
#Market and Competitor Analysis #Customer Success Stories #Diagram
-

Successful Quit Smoking Profile – Customer Success Stories
#Company Introduction #Customer Success Stories #Diagram
-

Manpower & Key Customer Introduction Slides – Team and Achievements
#Company Introduction #Customer Success Stories #Diagram
-

Kids Study Interview Slide – Success Stories with Cluster Approach
#Customer Success Stories #Diagram #Introduction of Key Customers
