Business Area Introduction Slide – Vision and Opportunities for Business
RM0300007_13
- Last Update 02/08/2025
- File Size 1.4MB
- # of Slides 2
- File Format PPTX
- Slide Ratio 16:9
- Color
Keywords
- #Content-Based Slides
- #Design-Based Slides
- #Company Introduction
- #Business Introduction
- #Diagram
- #Business Areas
- #Business Areas
- #Cluster
- #Table
- #Chain Diagram
- #16:9
- #connection diagram PowerPoint
- #cluster diagram slide template
- #5-node diagram PowerPoint
- #business area introduction slide
- #business relationship map presentation
About the Product
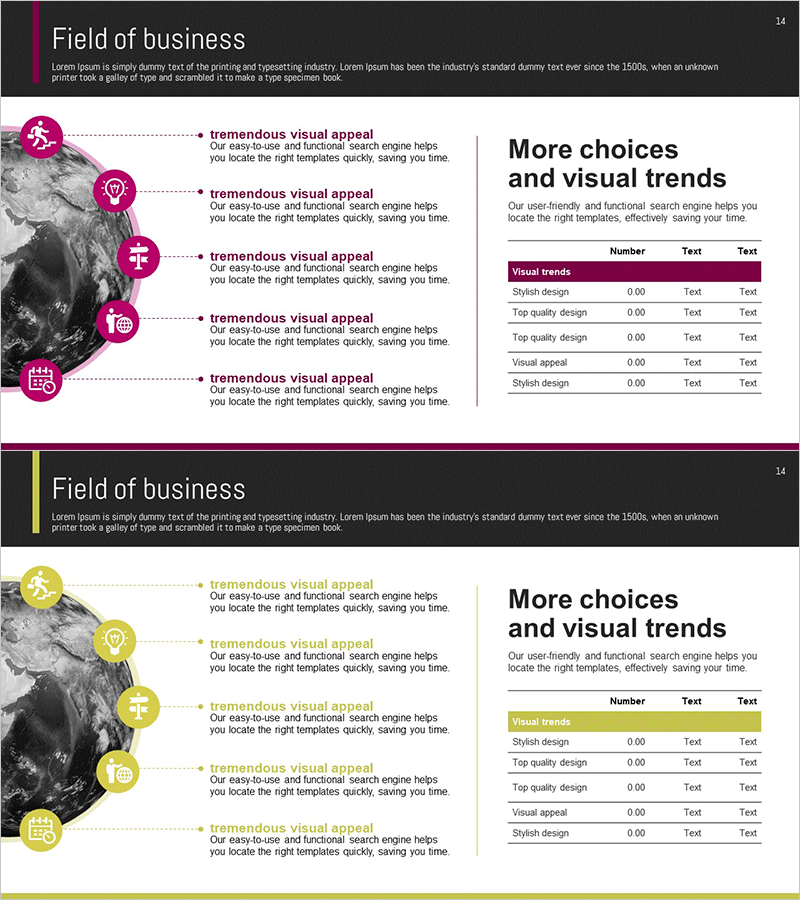
A cluster diagram PowerPoint slide that connects business vision and opportunities through five interconnected nodes. The structure radiates from a central core concept to five directional nodes, each featuring circular icons and text input areas. Colorful circular nodes in magenta, yellow, pink, and purple are connected by dotted lines, with a visual trends comparison table positioned on the right side. This PowerPoint slide is ready to use for business strategy presentations, organizational structure explanations, project relationship mapping, and various corporate communication needs.
Usage Points
-
Main Usage
Visually connects a central business vision or core concept to five related opportunities, strategies, or business areas. Designed to present complex relationships such as organizational hierarchies, project dependencies, business ecosystems, and strategic connections in a single, comprehensible view.
-
How to Use
Enter the core concept (vision, goal, or strategy) in the central node, then populate the five surrounding nodes with detailed items. Edit node text and colors to customize for organizational levels, project phases, or business domains. Add quantitative data in the right-side table to complement the diagram with numerical information.
-
Recommended For
Recommended for executive and strategy team business planning presentations, marketing team market opportunity analysis, project manager stakeholder mapping, organizational restructuring explanations, and new business area introductions. Particularly effective when presenting five or more related elements with equal importance.
-
Slide Structure
Composed of one central circular node plus five surrounding circular nodes (magenta, yellow, pink, purple, and additional colors) connected by dotted lines. Each node includes an icon area and text input field. A 4-row by 3-column data comparison table on the right side provides quantitative information support.
Related Products
-

Real Estate Business Area Diagram – Business Introduction and Cluster
#Company Introduction #Business Introduction #Diagram
-

Entertainment Business Sector Diagram – Cluster Design
#Company Introduction #Business Introduction #Diagram
-

Business Area Flower Diagram – Ideal for Company Introductions
#Company Introduction #Business Introduction #Diagram
-

Big Data Analysis Area Diagram
#Company Introduction #Business Introduction #Diagram
