Man Silhouette Organization Chart – Visual Organization Structure Overview
RM0300002_8
- Last Update 02/07/2025
- File Size 4.2MB
- # of Slides 2
- File Format PPTX
- Slide Ratio 16:9
- Color
Keywords
- #Content-Based Slides
- #Design-Based Slides
- #Company Introduction
- #Technical Approach
- #Diagram
- #Organizational Chart
- #Service Components
- #Structure
- #Cluster
- #Tree Diagram
- #Chain Diagram
- #16:9
- #organization chart PowerPoint slide
- #man silhouette diagram
- #hierarchical structure presentation
- #organizational chart template
- #3-level org chart
About the Product
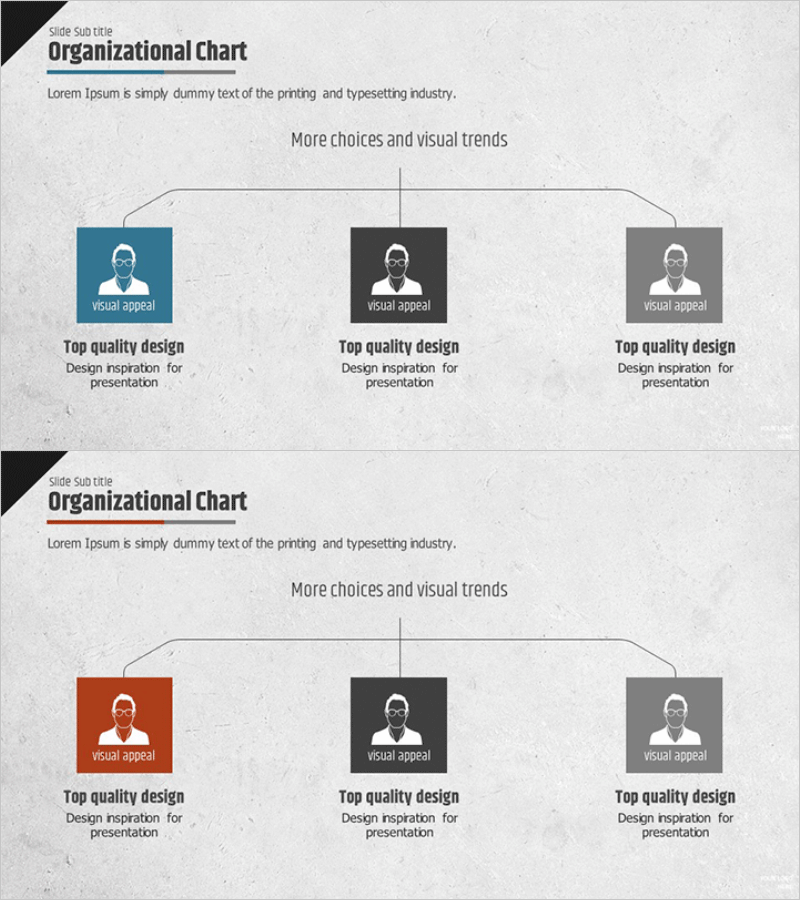
A hierarchical organization chart PowerPoint slide using man silhouette icons to represent three organizational levels. The structure flows from a central leadership node at the top, branching downward to three department nodes in blue, black, and gray. Each node combines a person silhouette icon with editable text areas for titles, departments, and roles. This 16:9 two-slide set clearly visualizes company structure, team composition, and reporting lines for corporate presentations and organizational introductions.
Usage Points
-
Main Usage
Visualize company organizational structure, team hierarchy, and reporting relationships using man silhouette icons. This diagram clearly communicates roles, departments, and chain of command, making it ideal for company introductions, employee onboarding, organizational restructuring announcements, and management briefings.
-
How to Use
The top center node represents leadership, with three department nodes branching below in blue, black, and gray. Edit the text areas in each node to add job titles, department names, and responsibilities. Maintain the color scheme or customize with your company brand colors to emphasize organizational hierarchy. Use both slides to present overall structure and detailed departmental information sequentially.
-
Recommended For
Company introduction decks, employee onboarding materials, organizational restructuring announcements, technical department team overviews, and executive reports. Ideal for HR professionals, executives, team leaders, and consultants presenting organizational structure and team composition.
-
Slide Structure
Slide 1: Central leadership node at top connected by vertical line to three department nodes below, arranged in blue, black, and gray. Each node contains a man silhouette icon and editable text field. Slide 2: Same hierarchical structure with alternative color variations to accommodate different organizational scenarios and visual preferences.
Related Products
-

Medical Business Area Circular Diagram – Understanding Organizational Structure
#Company Introduction #Technical Approach #Diagram
-

Company Team Structure – Clear Presentation Through Organizational Chart
#Company Introduction #Diagram #Organizational Chart
-

Hexagonal Organizational Chart Diagram – Visualizing Company Structure
#Company Introduction #Technical Approach #Diagram
-

Computer Company Introduction Slides - Organizational Chart Diagram
#Company Introduction #Diagram #Organizational Chart
