Global Target Country Strategy – A Launchpad for Global Marketing
RM0300001_11
- Last Update 02/06/2025
- File Size 0.8MB
- # of Slides 2
- File Format PPTX
- Slide Ratio 16:9
- Color
Keywords
- #Content-Based Slides
- #Design-Based Slides
- #Company Introduction
- #Marketing Plan and Strategy
- #Other
- #Global Network
- #Target Market Strategy
- #Map
- #16:9
- #global network map PowerPoint
- #world map PowerPoint slide
- #global marketing map slide
- #international business map PPT
- #how to create a global strategy presentation
About the Product
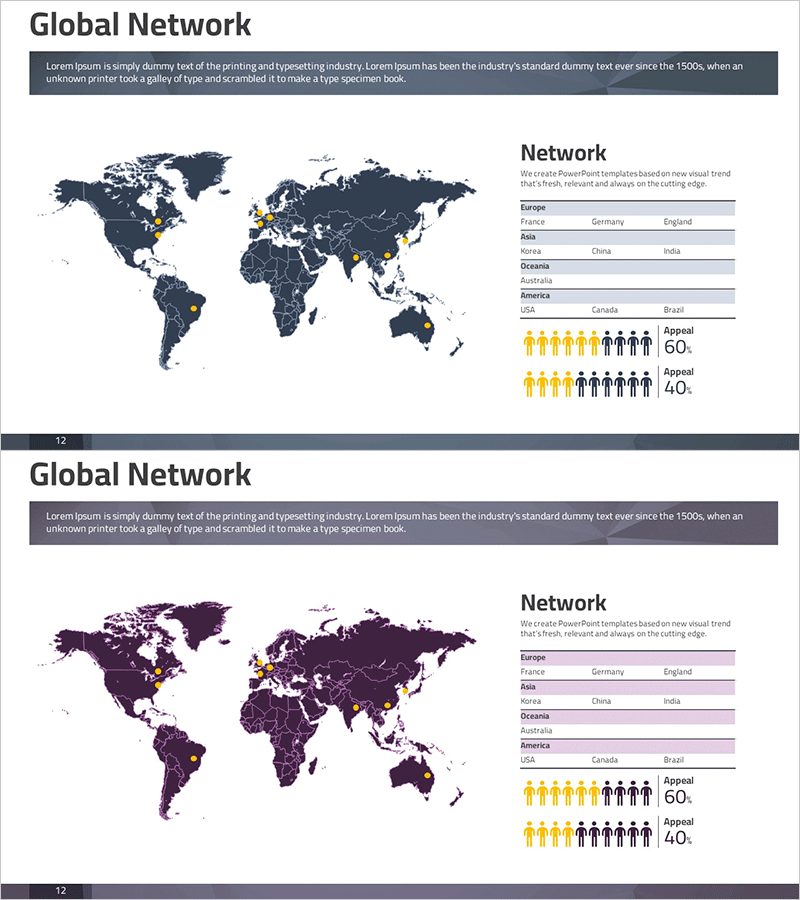
A world map-based PowerPoint slide optimized for global marketing strategy and international business presentations. Provided in two color versions—dark blue and wine tone—each slide features a geographic map highlighting network presence, a regional country list table, and demographic comparison icons. Perfect for communicating your company's global expansion status, target market strategy, and international partnerships at a glance. Available in 16:9 widescreen PPTX format, ready for immediate editing and customization.
Usage Points
-
Main Usage
Designed to visually communicate your company's global expansion status, international market entry strategy, and global network development. The world map highlights key market countries while effectively showcasing regional business operations and partnership networks.
-
How to Use
Integrate into the global network section of company profile presentations, international market analysis pages in marketing plans, or global expansion strategy segments in investor pitch decks. Customize the map highlights and country listings to match your specific business operations and markets.
-
Recommended For
Ideal for corporate executives, international marketing managers, overseas business development teams, and investor relations professionals presenting global business strategies. Suitable for multinational corporations, import-export companies, and startups pursuing global expansion initiatives.
-
Slide Structure
Two-slide set featuring a dark blue world map with highlighted key markets and a regional country list table on the right side in the first slide. The second slide provides the same layout in wine tone for color flexibility. Demographic comparison icons are positioned at the bottom of each slide for visual balance and data representation.
Related Products
-

Visualizing Worldwide Maritime Transportation Status – Global Market Strategy
#Company Introduction #Marketing Plan and Strategy #Diagram
-

Setting a Target Country Strategy – Insights for Global Markets
#Company Introduction #Marketing Plan and Strategy #Diagram
-

A Global Network that Spreads Across the World – Target Market Strategy
#Company Introduction #Marketing Plan and Strategy #Diagram
-

Setting Global Target Regional Strategies – Visualized with Sleek Diagrams and Clusters
#Company Introduction #Marketing Plan and Strategy #Diagram
