AI-Based Data Analytics System for Health Fitness Experts
RM0200019_10
- Last Update 02/06/2025
- File Size 14.2MB
- # of Slides 2
- File Format PPTX
- Slide Ratio 16:9
- Color
Keywords
- #Content-Based Slides
- #Design-Based Slides
- #Technical Approach
- #Diagram
- #Other
- #Service Components
- #Service Implementation Plan
- #Cluster
- #Chain Diagram
- #16:9
- #radial diagram PowerPoint
- #connection diagram slide
- #AI data analytics presentation
- #fitness system diagram
- #service architecture PowerPoint template
About the Product
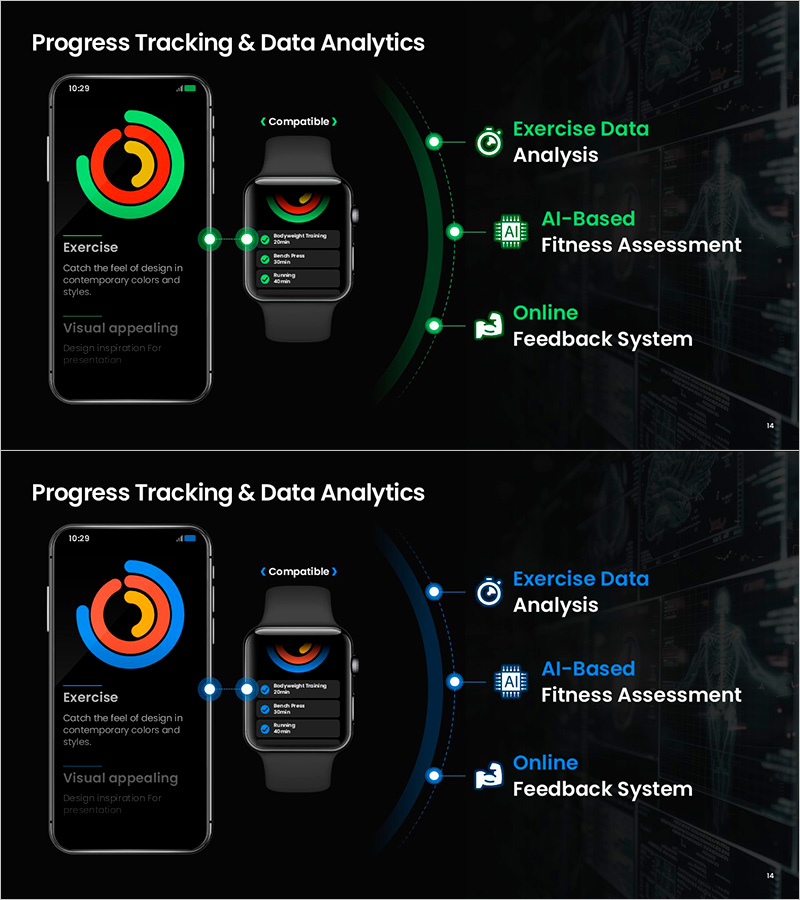
A radial connection diagram PowerPoint slide visualizing an AI-based data analytics system for fitness professionals. The design features a central hub (AI-Based Fitness Assessment) with three key components radiating outward: Exercise Data Analysis, AI-Based Fitness Assessment, and Online Feedback System. Set against a dark background with green and blue accent colors, the slide conveys technical sophistication and innovation. Includes smartphone and smartwatch mockups to illustrate real-world service implementation. Perfect for health coaches, fitness experts, and healthcare companies presenting service architecture, system workflows, and technology integration strategies. Delivered in 16:9 widescreen format, 2-slide PPTX file.
Usage Points
-
Main Usage
Visualizes complex AI-driven service architecture by radiating key components from a central hub. Clearly communicates system relationships and functional dependencies, making technical concepts accessible to non-technical stakeholders and investors.
-
How to Use
Deploy in fitness app pitches, healthcare platform technology overviews, investor presentations, and service implementation roadmaps. The smartphone and smartwatch mockups demonstrate actual user interfaces, bridging the gap between backend systems and end-user experience.
-
Recommended For
Health and fitness professionals, fitness coaches, healthcare executives, data science teams, health-tech startup founders, wellness service product managers, medical device companies, and investors seeking clear system architecture visualization.
-
Slide Structure
Central circular node (AI-Based Fitness Assessment) with three radiating branches connected by dotted lines and circular connection points. Left side displays smartphone mockup with exercise tracking interface; center shows smartwatch compatibility; right side lists three main features with icons. Two color variants provided: green-accent and blue-accent versions for flexible presentation themes.
Related Products
-

Modern Blue Presentation Diagram2 – Effective Visualization of Service Composition
#Technical Approach #Diagram #Service Components
-

Mobile App Service Sector Diagram – Visualizing Business Components
#Company Introduction #Technical Approach #Diagram
-

Circular Connection Diagram – Operations Plan and Service Execution
#Operational Plan #Technical Approach #Diagram
-

Technical Aspects of the Performance – Immersive Experience Through Lighting and Sound
#Technical Approach #Diagram #Service Components
