Circular SWOT Analysis Diagram – Optimize Market and Competitive Analysis
RM0200016_14
- Last Update 02/06/2025
- File Size 0.3MB
- # of Slides 2
- File Format PPTX
- Slide Ratio 16:9
- Color
Keywords
About the Product
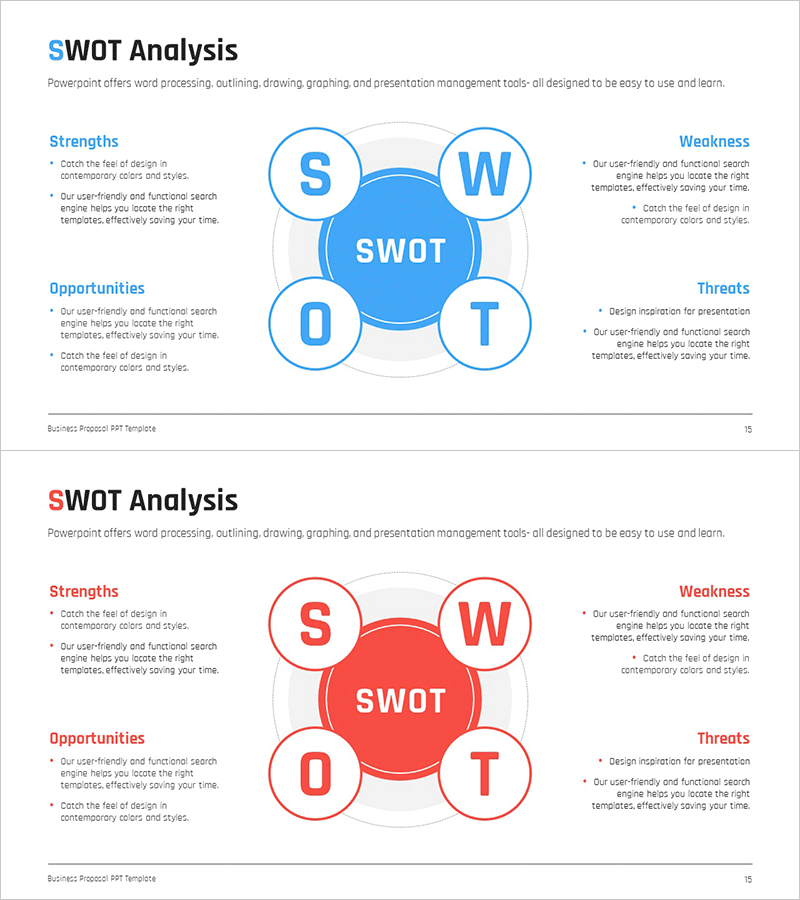
A radial SWOT analysis diagram PowerPoint slide featuring a central SWOT node surrounded by four balanced circles representing Strengths, Weaknesses, Opportunities, and Threats. This presentation template comes in two color versions—blue and red—allowing you to select the design that best matches your corporate branding or presentation context. Each quadrant provides dedicated text areas for detailed analysis, making it ideal for market assessment, competitive analysis, and strategic planning sessions. The 16:9 widescreen format ensures compatibility with modern projectors and displays, and the fully editable PPTX format allows instant customization for your specific business needs.
Usage Points
-
Main Usage
A strategic analysis tool that systematically visualizes a company's strengths, weaknesses, opportunities, and threats. The radial layout with a central SWOT hub and four balanced nodes supports strategic planning, business development, and competitive positioning across executive briefings and board presentations.
-
How to Use
Enter your analysis content into the text boxes for each quadrant (S, W, O, T) and present during strategy meetings, investor pitches, business planning sessions, or competitive analysis reviews. Customize colors, adjust node sizes, or modify text formatting to emphasize key insights and align with your presentation flow.
-
Recommended For
Executives, strategy managers, marketing teams, business development professionals, management consultants, and MBA students conducting market analysis, competitive assessment, new product launches, or organizational restructuring initiatives. Ideal for C-suite presentations and strategic decision-making forums.
-
Slide Structure
Central circular SWOT node surrounded by four equally-sized circles positioned at cardinal points (top, bottom, left, right) representing S, W, O, and T. Connection lines link each outer node to the center. Supporting text descriptions are positioned on the left (Strengths and Opportunities) and right (Weaknesses and Threats) sides. Includes 2 slides: one in blue palette and one in red palette.
Related Products
-

SWOT Analysis Arrow Circular Diagram - Market and Competitor Analysis
#Market and Competitor Analysis #Diagram #SWOT Analysis
-

SWOT Analysis Square Diagram – A Useful Template for Market Analysis
#Market and Competitor Analysis #Diagram #SWOT Analysis
-

SWOT Circular Segmentation Diagram – Market Analysis and Strategy Development
#Market and Competitor Analysis #Diagram #SWOT Analysis
-

Diamond Overlay SWOT Diagram
#Market and Competitor Analysis #Diagram #SWOT Analysis
