History Circular Diagram – Visualizing Company History
RM0200015_5
- Last Update 02/05/2025
- File Size 0.8MB
- # of Slides 2
- File Format PPTX
- Slide Ratio 16:9
- Color
Keywords
About the Product
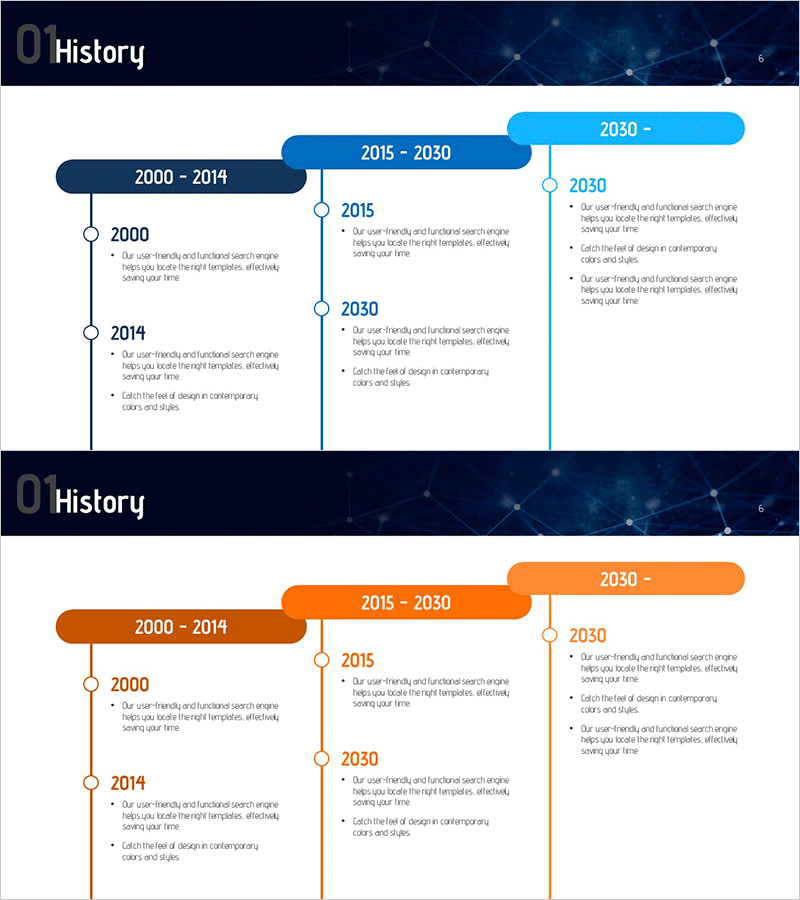
A circular diagram PowerPoint slide that visually represents your company's key milestones and development history. Featuring a dark blue background with three time periods (2000-2014, 2015-2030, 2050-) connected in a circular node structure, this slide clearly organizes major events and achievements for each era. The combination of circular nodes and vertical timeline layout makes it ideal for company introduction, corporate history sections, and business presentations. Includes 2 slides with multiple color variations (blue and orange), with fully editable text and data fields for immediate use.
Usage Points
-
Main Usage
Effectively communicate your company's growth journey from founding to present by arranging major development stages chronologically. The circular node structure emphasizes each era's characteristics and achievements, adding credibility to investor pitches, partnership presentations, and employee onboarding sessions.
-
How to Use
Use this slide in the company history section of corporate presentations to visually explain your business evolution. Input years, key events, and accomplishments into each circular node, then edit the timeline text to build your company's growth narrative. Perfect for investor relations meetings, recruitment presentations, and corporate overview materials to enhance audience comprehension.
-
Recommended For
Corporate communications and marketing professionals, executives, investor relations (IR) specialists, HR and recruitment teams, and consultants presenting company history and growth trajectories. Particularly effective for mid-to-large enterprises or startups with significant milestones, emphasizing organizational growth stories.
-
Slide Structure
The first slide features a dark blue background with three time periods (2000-2014, 2015-2030, 2050-) represented as circular nodes connected by a vertical timeline. Each node accommodates four text items for detailed information. The second slide provides the identical structure in orange color, offering flexible color variation options.
Related Products
-

Business History Connection Diagram – Company Growth Story
#Company Introduction #Diagram #History
-

Introduction to the History of the Architectural Company – A Visual Timeline
#Company Introduction #Diagram #Company Overview
-

Portfolio Profile Slide – Company Timeline and Cluster
#Company Introduction #Diagram #History
-

Silhouette History Diagram – Visualizing Evolution
#Company Introduction #Diagram #Other
