Visualizing Business Strategy with Milestone Plan Schedule
RM0200013_27
- Last Update 02/05/2025
- File Size 0.3MB
- # of Slides 2
- File Format PPTX
- Slide Ratio 16:9
- Color
Keywords
- #Content-Based Slides
- #Design-Based Slides
- #Business Strategy
- #Business Management
- #Diagram
- #Roadmap
- #Implementation Plan
- #Cluster
- #Table
- #Closed Cluster Diagram
- #16:9
- #milestone timeline diagram PowerPoint
- #project schedule slide template
- #4-phase project management chart
- #business roadmap PowerPoint slide
- #how to create milestone timeline in PowerPoint
About the Product
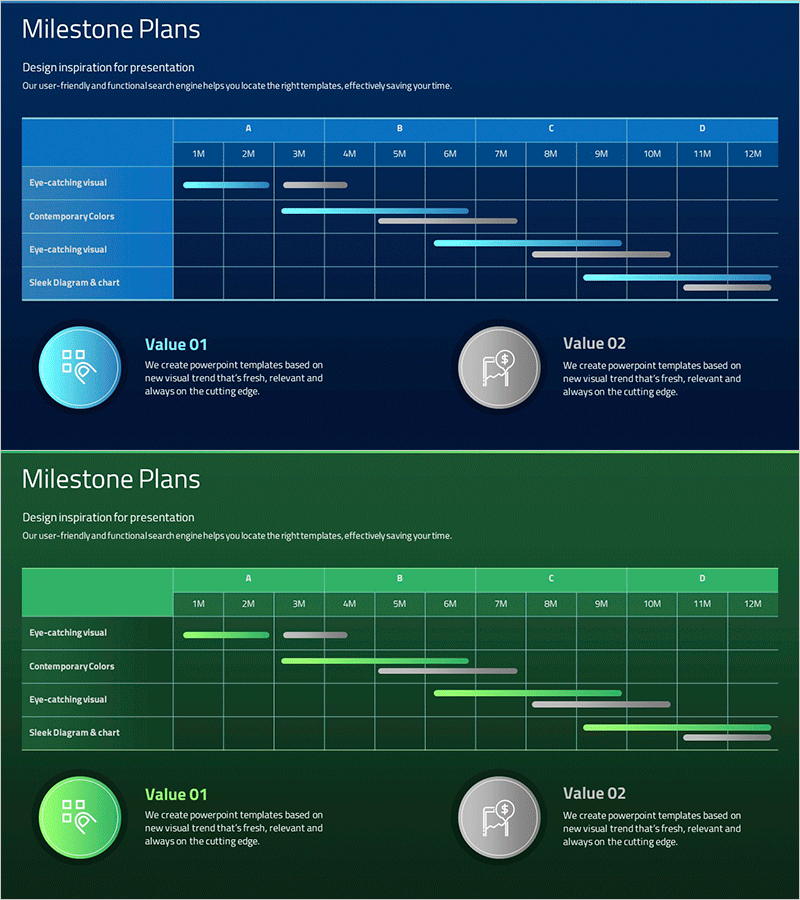
A milestone timeline PowerPoint slide that visualizes project schedules across four phases (A, B, C, D) over 12 months. This diagram effectively displays project milestones, marketing campaigns, product development roadmaps, and strategic initiatives with clear phase separation and monthly intervals. The template includes two color versions—dark blue and lime green—each using light cyan and gray bars to distinguish planned periods from scheduled timelines. The 2-slide set is fully editable and optimized for 16:9 widescreen presentations, making it ideal for business planning, investor presentations, and team alignment meetings.
Usage Points
-
Main Usage
This timeline diagram enables stakeholders to understand project phases and key milestones at a glance. By visualizing four phases across 12 monthly intervals, it clearly communicates project roadmaps to team members and decision-makers. Ideal for business planning, marketing campaign timelines, product development schedules, and organizational change initiatives.
-
How to Use
Enter project activities at the intersection of each phase (A, B, C, D) and month (1M–12M). Light cyan bars represent planned periods while gray bars indicate scheduled timelines—adjust them to match actual progress. Add icons and text labels to highlight key activities within each phase for better clarity.
-
Recommended For
Business strategists, project managers, marketing professionals, and product development teams use this template to report and plan medium-term projects. It's particularly effective for investor pitch decks, business planning presentations, and internal strategy alignment meetings where clear project timelines are essential.
-
Slide Structure
2-slide set featuring a 4-row by 12-column timeline table structure. Each slide displays phases (A, B, C, D) vertically and months (1M–12M) horizontally with color-coded progress bars. Includes dark blue and lime green background versions, each with Value 01 and Value 02 icon explanations at the bottom.
Related Products
-

Key Events Roadmap – Business Strategy and Diagram Utilization
#Business Strategy #Business Management #Diagram
-

Project Plan Setup Table Chart – Business Strategy
#Business Strategy #Business Management #Diagram
-

Colorful Project Milestones – Visualization of Business Strategies
#Business Strategy #Business Management #Operational Plan
-

Key Schedule Schedule – Roadmap for Business Strategy
#Business Strategy #Business Management #Diagram
