Quality Assurance Process – Business Management and Efficiency
RM0200010_26
- Last Update 10/06/2025
- File Size 0.3MB
- # of Slides 2
- File Format PPTX
- Slide Ratio 16:9
- Color
Keywords
- #Content-Based Slides
- #Design-Based Slides
- #Business Management
- #Diagram
- #Implementation Schedule
- #Quality Assurance Plan
- #Flow
- #Structure
- #Multidirectional Flow
- #Tree Diagram
- #16:9
- #tree diagram PowerPoint
- #quality assurance process slide
- #4-level flowchart
- #business management diagram
- #hierarchical structure PowerPoint slide
About the Product
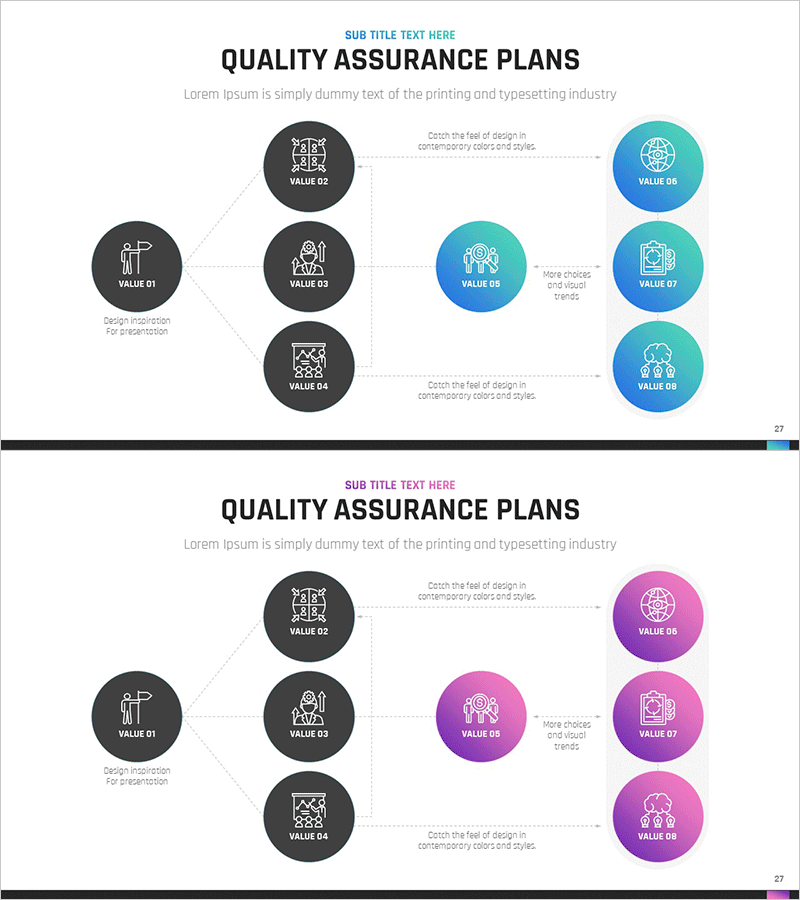
A PowerPoint slide that visualizes the quality assurance process using a 4-level tree structure. The diagram flows from left-side dark nodes to right-side blue and teal nodes, clearly representing business management stages and operational efficiency. Each node includes an icon to enhance information clarity, with dotted connector lines showing relationships between stages. This 2-slide set is ready to use in business presentations, strategic plans, management reports, and operational documentation.
Usage Points
-
Main Usage
Presents the hierarchical structure of quality assurance processes to emphasize business management efficiency. The tree layout flowing from primary items on the left to detailed items on the right clearly communicates an organization's quality control framework.
-
How to Use
Use in executive reports, business plans, and quality management training materials to explain process stages. Customize node text and icons with your organization's actual quality assurance items to create tailored presentation materials.
-
Recommended For
Ideal for executives, quality managers, business planning teams, and consultants explaining organizational quality frameworks or presenting process improvement strategies. Particularly suited for presentations requiring hierarchical information structures.
-
Slide Structure
A 4-level tree structure with one primary node (VALUE 01) on the left connecting to three middle nodes (VALUE 02–04), which then branch to three right-side nodes (VALUE 06–08). Features dark and blue-teal gradient nodes, dotted connector lines, and icons throughout.
Related Products
-

Business Revenue Structure Diagram – Visualizing Business Strategy
#Business Introduction #Business Vision and Strategy #Diagram
-

Mapping the Flow of Key Components – Multidirectional Service Operations
#Technical Approach #Diagram #Service Operation Plan
-

Quality Assurance Plan Structure – Effective Quality Management
#Business Management #Diagram #Implementation Schedule
-

Introducing the Quality Assurance Plan Schedule
#Business Management #Diagram #Implementation Schedule
