Business Report Analysis Table – A Solution for Efficient Management and Review
RM0200009_28
- Last Update 02/03/2025
- File Size 0.5MB
- # of Slides 2
- File Format PPTX
- Slide Ratio 16:9
- Color
Keywords
About the Product
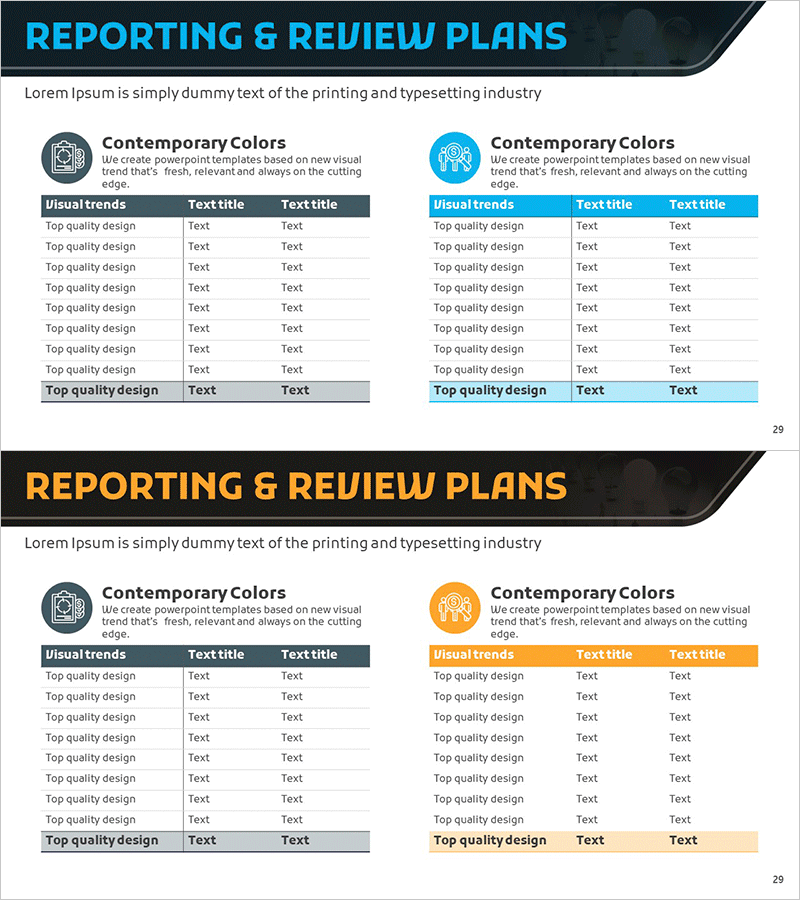
A 2-slide PowerPoint presentation designed for efficient business reporting and review planning. Features dual-color themes in blue and orange, with each slide containing a structured 3-column data table for visual trends and quality metrics. The layout clearly separates icon and context areas on the left from data visualization on the right, enabling intuitive information delivery. Ideal for business performance analysis, quarterly reviews, management dashboards, and comparative reporting across departments or time periods.
Usage Points
-
Main Usage
Visualize business performance metrics, comparative analysis, and review outcomes through structured data tables. The left-side icon area combined with right-side table layout ensures clear information hierarchy and audience comprehension. Supports quarterly reports, executive briefings, departmental performance reviews, and management dashboards.
-
How to Use
Input actual data into the table cells on each slide. Use the left icon area for category or department names, and populate the 3-column table with visual trends, quality indicators, and supporting details. Leverage the blue and orange header colors to represent two distinct comparison perspectives simultaneously.
-
Recommended For
Finance teams, operations managers, and executive reporting professionals. Best suited for quarterly and annual business reports, performance evaluation presentations, and management status briefings. Particularly effective when comparing multiple departments or visualizing metric changes over time.
-
Slide Structure
2-slide set with consistent layout: title area at top, left-side icon and text area (1 section), right-side 3-column table (1 header row + 8 data rows). One slide features blue theme, the other orange theme, enabling dual-perspective reporting in a single presentation.
Related Products
-

Report and Review Record Table – Efficient Business Management
#Business Management #Diagram #Execution Plan
-

Report and Review Plan Table – Efficient Business Management
#Business Management #Diagram #Execution Plan
-

Proposal Review Plan Items – Visualizing Data with Diagrams
#Business Management #Diagram #Execution Plan
-

Reporting & Review Plan Slide – Step-by-Step
#Business Management #Diagram #Text Box
