Service Area Diagram – Visualizing Business Model Composition
RM0200006_23
- Last Update 02/02/2025
- File Size 0.3MB
- # of Slides 2
- File Format PPTX
- Slide Ratio 16:9
- Color
Keywords
- #Content-Based Slides
- #Design-Based Slides
- #Company Introduction
- #Technical Approach
- #Diagram
- #Business Areas
- #Service Architecture Diagram
- #Spread
- #Centralized Diagram
- #16:9
- #radial diagram PowerPoint
- #center icon diagram slide
- #business model visualization template
- #service area diagram PPT
- #4-element composition slide
About the Product
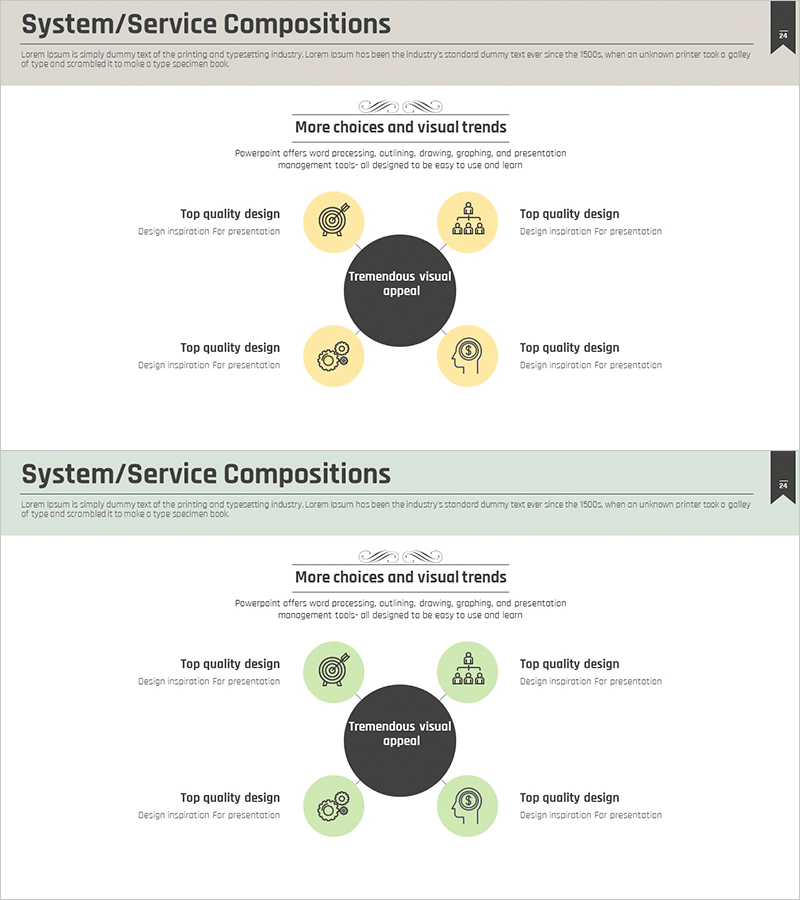
A radial diagram PowerPoint slide with a central core concept surrounded by four related elements arranged in a circular pattern. Yellow and green icon nodes visually represent each business area, service domain, technology component, or revenue stream. This 16:9 two-slide template effectively visualizes business model composition, value propositions, and organizational structure in company presentations and strategic pitches. Each element features editable text fields, allowing customization across industries and business contexts. The balanced radial layout ensures equal visual weight for all four components while maintaining focus on the central message.
Usage Points
-
Main Usage
Visualize a core business concept with four supporting elements—such as service areas, technology pillars, business divisions, or customer value propositions—in a balanced radial layout. The central dark circle anchors the main message while four surrounding icon nodes represent equal-weight components, enabling clear hierarchical communication of complex business structures.
-
How to Use
Deploy in company overview presentations during the 'Business Model' or 'Service Composition' section to explain core value propositions. Customize each icon area's text to reflect your company's business domains, technical capabilities, customer segments, or revenue models. Highly effective in investor pitch decks and strategic planning presentations where business architecture clarity is essential.
-
Recommended For
Executives, business development teams, marketing professionals, management consultants, and startup founders presenting business models. Particularly suited for service firms, technology companies, consulting practices, financial institutions, and enterprises needing to communicate organizational structure and value delivery clearly.
-
Slide Structure
Two-slide template featuring a radial layout with a central dark circle (core message input area) surrounded by four evenly-spaced circular icon nodes. Yellow and green accent colors differentiate each element, with editable text fields positioned below each icon. The balanced radial arrangement creates visual symmetry while maintaining clear information hierarchy and focus on the central concept.
Related Products
-

Idea Strategy Diagram – Innovative Approach and Design
#Company Introduction #Technical Approach #Diagram
-

Business Idea Content and Operating Plan Presentation Slide
#Company Introduction #Technical Approach #Diagram
-

Financial Business Area Circular Diagram – Effective Visualization for Business Introduction
#Company Introduction #Business Introduction #Diagram
-

Medical Field Illustration Diffusion Diagram – Visualizing Healthcare Innovation
#Company Introduction #Product/Service Introduction #Diagram
