Service Operation Plan Chart – Effective Technology Operations Planning
RM0200005_22
- Last Update 02/02/2025
- File Size 3.9MB
- # of Slides 2
- File Format PPTX
- Slide Ratio 16:9
- Color
Keywords
- #Content-Based Slides
- #Design-Based Slides
- #Operational Plan
- #Technical Approach
- #Diagram
- #Project Implementation Schedule
- #Service Operation Plan
- #Table
- #16:9
- #service operation plan PowerPoint slide
- #technology operation plan comparison table
- #system operation strategy PPT
- #how to create operation plan in PowerPoint
- #operational planning template
About the Product
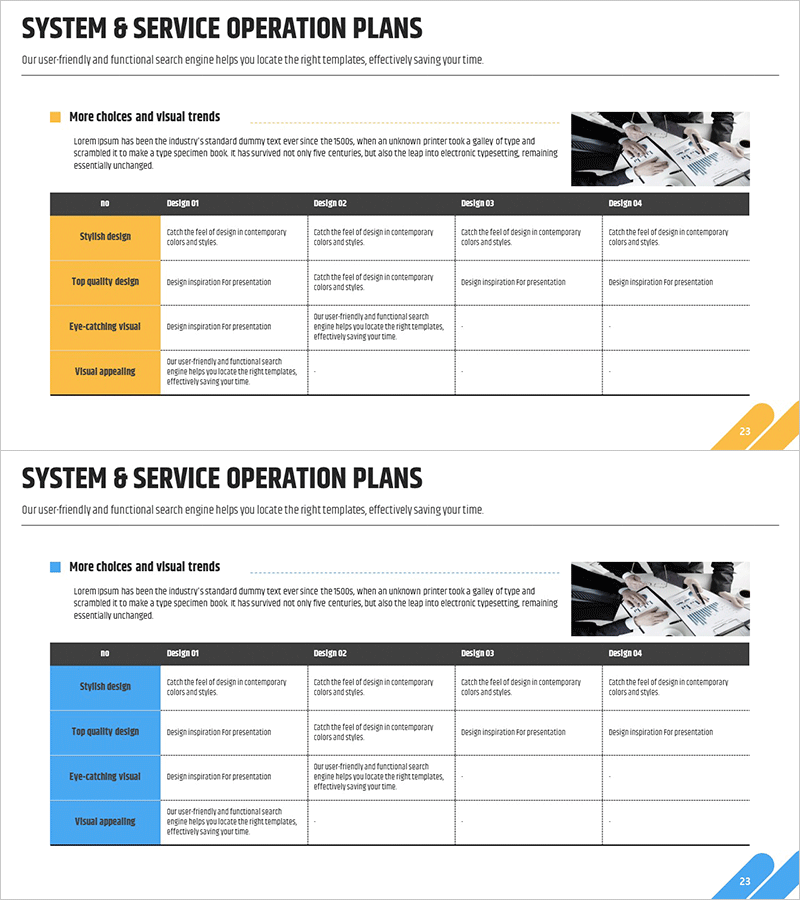
A professional PowerPoint slide for presenting technology operation plans and service improvement strategies. This 2-slide set features comparison table layouts in two color themes: yellow and blue. Each slide includes 4 design options (Design #1 through #4) with 4 evaluation criteria rows: stylish design, top quality design, eye-catching visual, and visual appealing. The structured table format enables clear side-by-side analysis of multiple operation approaches. Ideal for technology department presentations, system improvement reviews, and operational strategy discussions.
Usage Points
-
Main Usage
Present technology operation plans and service improvement proposals in a structured comparison format to support decision-making. Compare multiple operational approaches simultaneously and clearly visualize the strengths and weaknesses of each option.
-
How to Use
Use the yellow theme to emphasize key content and the blue theme to convey technical credibility. Customize the table row criteria (style, quality, visual, appeal) as your operational evaluation metrics, or replace the column design options with specific operational approaches.
-
Recommended For
Recommended for IT department and technology team operation planning presentations, system improvement review meetings, and technical strategy development sessions. Highly effective when communicating operational approach differences to executives and stakeholders.
-
Slide Structure
Both slides follow identical structure with title area at top, 4-column × 4-row comparison table in center (rows: stylish design, top quality, eye-catching visual, visual appealing; columns: Design #1-#4), and reference image space in upper right. All cells support text input with only color theme variation.
Related Products
-

Calendar Safety Roadmap – Business Strategy and Timeline
#Business Strategy #Operational Plan #Diagram
-

Business Schedule Table PPT – Business Strategy and Operations Plan
#Business Strategy #Operational Plan #Diagram
-

Schedule Chart for Goals – Visualizing Business Plans and Timelines
#Business Management #Operational Plan #Diagram
-

Business Promotion Calendar - An Effective Tool for Business Strategy
#Business Strategy #Operational Plan #Diagram
