Visualizing Business Strategy with Calendar Diagram
RJ0400057_28
- Last Update 06/02/2025
- File Size 0.8MB
- # of Slides 2
- File Format PPTX
- Slide Ratio 16:9
- Color
Keywords
- #Content-Based Slides
- #Design-Based Slides
- #Business Strategy
- #Operational Plan
- #Diagram
- #Roadmap
- #Project Implementation Schedule
- #Table
- #16:9
- #calendar diagram PowerPoint slide
- #monthly schedule presentation template
- #business timeline visualization
- #operational planning slide
- #how to create a calendar in PowerPoint
About the Product
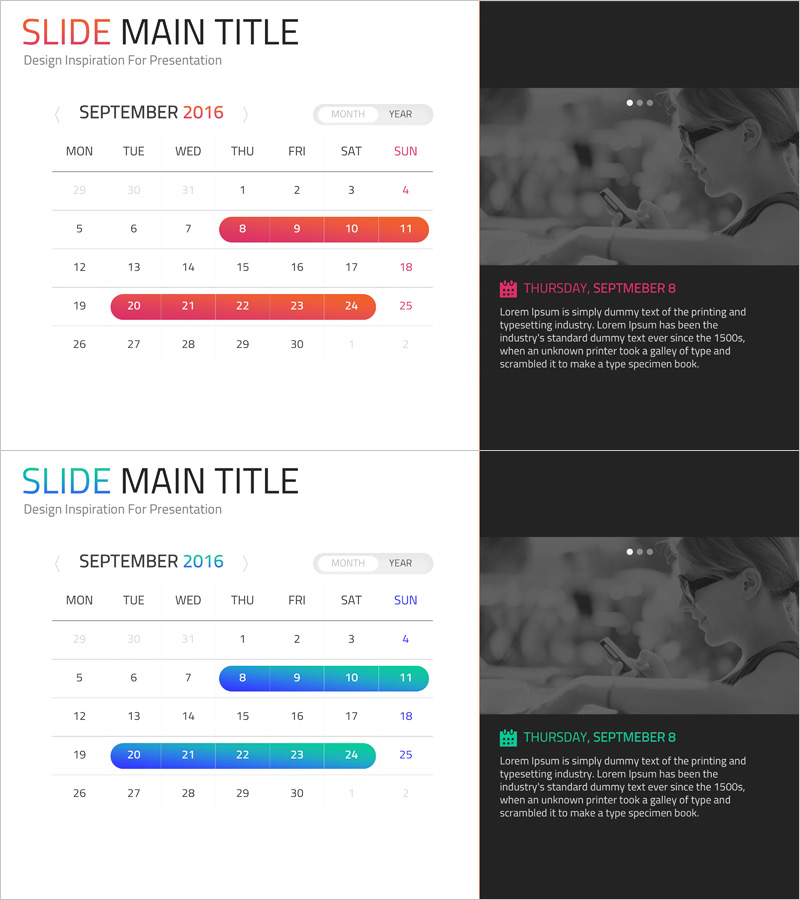
A calendar diagram PowerPoint slide designed to visualize business strategy and operational planning with monthly schedules. This 2-slide set features a day-of-week grid layout with accent colors (red, blue, turquoise) to clearly highlight important dates and time periods. The accompanying text description area allows detailed documentation of schedule context and objectives, making it ideal for presentations, reports, and slide decks. Optimized for 16:9 widescreen format in PPTX, ready for immediate editing and presentation use.
Usage Points
-
Main Usage
Visualize monthly business schedules, project timelines, and operational plans in calendar format, enabling teams to share schedules and track progress at a glance during strategic planning sessions.
-
How to Use
Enter key monthly dates and milestones into the calendar grid, use accent colors to highlight critical periods, and document detailed information in the text area. Present the completed slide to communicate project schedules and operational timelines to stakeholders.
-
Recommended For
Business planning presentations, quarterly strategy meetings, project kickoff sessions, and team scheduling updates. Ideal for project managers, business planners, and executives who need to communicate monthly and quarterly timelines clearly.
-
Slide Structure
Two-slide layout with a 7x7 calendar grid (including day headers) on the left side and a date selection indicator with text description box on the right. Supports multiple date ranges using accent colors, with text area capacity for 3-4 paragraphs of detailed schedule information.
Related Products
-

Calendar Business Promotion Schedule – Strategic Roadmap
#Business Strategy #Operational Plan #Diagram
-

Newspaper Wide PowerPoint Template Schedule – Business Strategy
#Business Strategy #Operational Plan #Diagram
-

Logistics Industry Future Plan – Strategic Business Roadmap
#Business Strategy #Operational Plan #Diagram
-

Schedule Checklist for Business Strategy – Efficient Management
#Business Strategy #Operational Plan #Diagram
