System Services Diffusion Diagram - Visualization for Technology Sector
RM0200002_23
- Last Update 02/01/2025
- File Size 0.6MB
- # of Slides 2
- File Format PPTX
- Slide Ratio 16:9
- Color
Keywords
- #Content-Based Slides
- #Design-Based Slides
- #Technical Approach
- #Diagram
- #Service Architecture Diagram
- #System Architecture Diagram
- #Spread
- #Centralized Diagram
- #16:9
- #radial diagram PowerPoint
- #diffusion diagram slide
- #central node diagram
- #system architecture PPT
- #service composition slide
- #how to create radial diagram in PowerPoint
About the Product
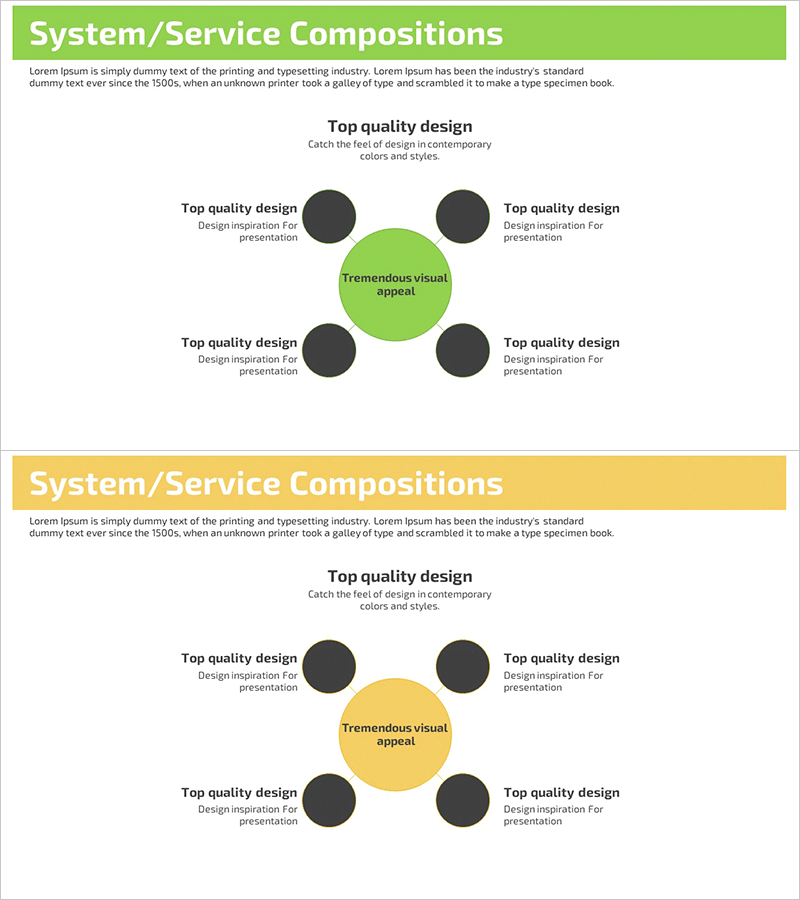
A radial diffusion diagram PowerPoint slide with a central concept expanding to four directional nodes. The lime-green central circle connects to four dark-gray nodes positioned at top, bottom, left, and right, visualizing system architecture, service composition, technology components, and organizational relationships. This 2-slide 16:9 presentation template is ready to use for technical architecture explanations, service structure diagrams, organizational hierarchies, and business model presentations. Each node includes editable text areas for customization to your specific topic.
Usage Points
-
Main Usage
Clearly expresses the relationship between a central concept and surrounding elements through a radial structure. Ideal for showing core technology functions with connected modules, service core values with component elements, or central departments with collaborative teams.
-
How to Use
In technical presentations or product introductions, enter the core concept in the central green circle and fill the four nodes with detailed items. The contrast between lime-green and dark-gray automatically creates visual emphasis, directing audience attention to key information.
-
Recommended For
Recommended for technology professionals, product managers, and executives presenting system architecture, service composition, and organizational structures. Suitable for tech companies, startups, and consulting firms conducting technical seminars, investor presentations, and internal reports.
-
Slide Structure
2-slide set. Each slide features a lime-green central circle (editable text area) with four dark-gray nodes positioned at cardinal directions. Clear connecting lines link the center to each node, with dedicated text input areas in each node for easy customization.
Related Products
-

Core Values Linked to the Central System
#Technical Approach #Diagram #Service Architecture Diagram
-

Constructing a Robust Service Model with Diagrams
#Technical Approach #Diagram #Service Architecture Diagram
-

Business Service and System Configuration Diagram – Integrated Approach
#Technical Approach #Diagram #Service Architecture Diagram
-

Securities Services Diffusion Diagram – Effective System Composition
#Technical Approach #Diagram #Service Architecture Diagram
