Financial Performance and Estimates by Business Slide
RM0100020_14
- Last Update 01/31/2025
- File Size 16.7MB
- # of Slides 2
- File Format PPTX
- Slide Ratio 16:9
- Color
Keywords
- #Content-Based Slides
- #Design-Based Slides
- #Financial Plans and Performance
- #Diagram
- #Budget
- #Key Financial Indicators
- #Table
- #16:9
- #financial performance PowerPoint slide
- #financial estimates comparison table
- #business division financial data PPT
- #how to create financial comparison slides in PowerPoint
- #financial analysis table template
About the Product
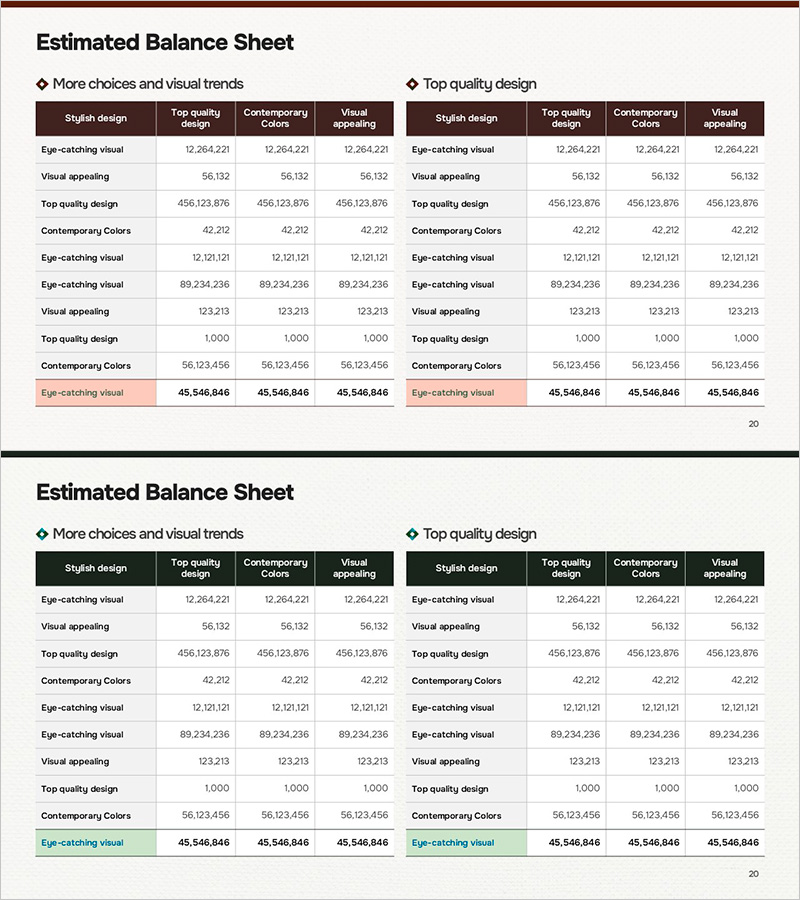
A PowerPoint slide that enables side-by-side comparison of financial performance and estimates by business division. The slide features two versions: 'More choices and visual trends' on the left and 'Top quality design' on the right, each with four columns (Stylish design, Top quality design, Contemporary Colors, Visual appealing) for organizing financial data. The dark header row contrasts sharply with light data areas, maximizing numerical readability. Delivered in 16:9 widescreen PPTX format for immediate editing. Ideal for investor presentations, executive reports, and financial analysis materials.
Usage Points
-
Main Usage
Displays business division financial results and projected estimates simultaneously to support performance analysis and future planning. Used in investor briefings, shareholder meetings, and executive sessions to communicate financial status through objective metrics.
-
How to Use
Enter business division names in each row and input corresponding financial metrics (revenue, operating profit, EBITDA, etc.) in the four columns. Use the left version to explore design options and the right version as the final polished design for presentations.
-
Recommended For
CFOs, financial managers, investor relations (IR) professionals, and executive reporting teams. Particularly effective for quarterly earnings announcements, M&A negotiation materials, and new business investment review meetings to strengthen financial credibility.
-
Slide Structure
Two-slide set, each featuring a 10-row × 4-column table structure. The header row uses dark background with white text for emphasis, while data rows employ light backgrounds with black text for clarity. The final row (totals) is highlighted with a light orange background to visually distinguish summary information.
Related Products
-

Agricultural Budget Table – Harmony of Green and Purple
#Financial Plans and Performance #Diagram #Budget
-

Key Financial Indicators and Budget Slide – A Harmony of Blue and Red
#Financial Plans and Performance #Diagram #Budget
-

Travel Table Text Box – Visualizing Financial Plans and Outcomes
#Financial Plans and Performance #Diagram #Budget
-

Camping Business Financial Planning Table – Budget and Key Metrics
#Financial Plans and Performance #Diagram #Budget
