Asset Management Business Area Diagram – Cluster and Connection
RM0100017_7
- Last Update 01/30/2025
- File Size 0.3MB
- # of Slides 2
- File Format PPTX
- Slide Ratio 16:9
- Color
Keywords
- #Content-Based Slides
- #Design-Based Slides
- #Product/Service Introduction
- #Business Introduction
- #Diagram
- #Program Introduction
- #Business Areas
- #Cluster
- #Spread
- #Chain Diagram
- #Decentralized Diagram
- #16:9
- #cluster diagram PowerPoint
- #4-node connection diagram
- #business area PowerPoint slide
- #radial relationship diagram
- #organizational structure PPT template
About the Product
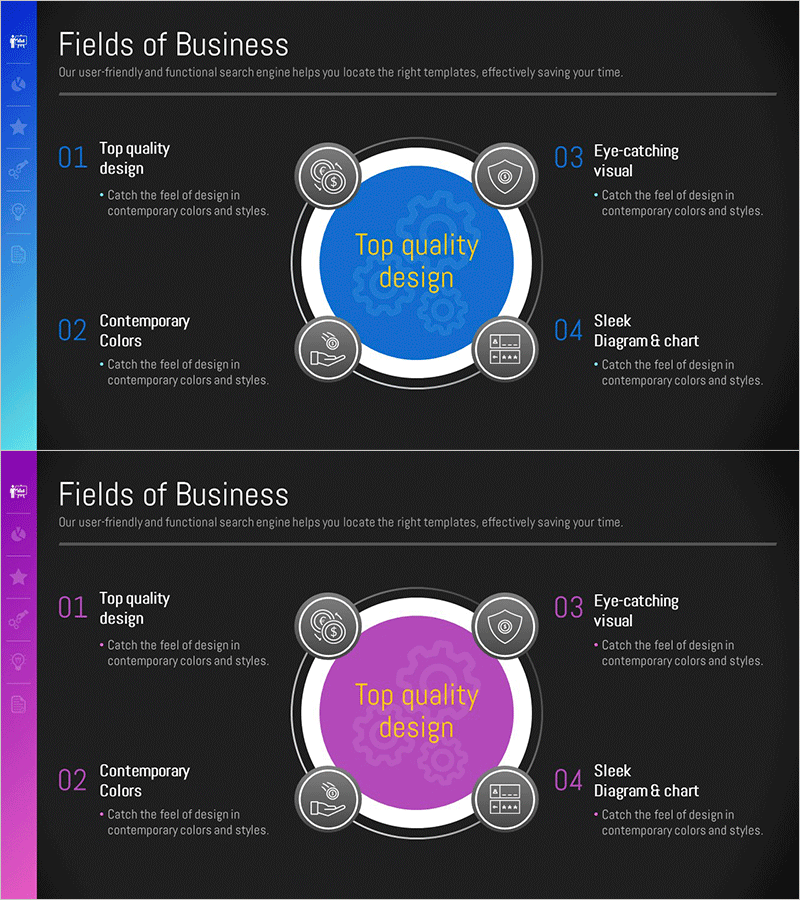
A 4-node cluster diagram PowerPoint slide for visualizing asset management and business area relationships. The design features a central circular hub surrounded by four circular nodes, each with icon placeholders and text input areas, connected by gray border lines and connectors. Set against a dark gray background with blue or pink accent colors on the central circle, this diagram effectively illustrates the relationship between core concepts and supporting elements in presentations. The 2-slide set includes color variations, delivered in 16:9 widescreen PPTX format for immediate editing and customization.
Usage Points
-
Main Usage
Ideal for presenting asset management systems, business area classifications, departmental relationships, and process connection structures using a center-to-periphery relationship model. Positions core concepts at the center with four related elements as nodes, enabling clear visualization of hierarchical relationships and interconnections.
-
How to Use
Enter department names, functions, or asset categories in each node's text area and place the main topic in the central circle. Select the color variation (blue or pink) that matches your presentation theme, and replace icons to represent each node's specific characteristics.
-
Recommended For
Executive reports, organizational structure explanations, asset management strategy presentations, business area analysis materials, and departmental role definition presentations. Suitable for consulting, finance, manufacturing, and public sector organizations requiring organizational system visualization.
-
Slide Structure
2-slide set featuring identical 4-node cluster layouts with blue and pink color schemes applied respectively. Each slide contains a central circular hub, four circular nodes (top-left, top-right, bottom-left, bottom-right), icon and text input areas for each node, and connector lines linking the center to all nodes.
Related Products
-

Company Stock Analysis Diagram – Stylish Design for Presentations
#Company Introduction #Business Introduction #Diagram
-

Space Industry Diffusion Diagram – Innovative Business Model Introduction
#Company Introduction #Business Introduction #Diagram
-

Diffusion Diagram of Scientific Research Fields – The Power of Connection
#Business Introduction #Diagram #Business Areas
-

Main Business Areas Triangle Diagram
#Company Introduction #Business Introduction #Diagram
