Price Quality Analysis Diagram – Strategic Insights for Business Success
RM0100016_28
- Last Update 01/30/2025
- File Size 0.3MB
- # of Slides 2
- File Format PPTX
- Slide Ratio 16:9
- Color
Keywords
- #Content-Based Slides
- #Design-Based Slides
- #Business Strategy
- #Marketing Plan and Strategy
- #Diagram
- #Step-by-Step Schedule Plan
- #Pricing Strategy
- #Cluster
- #Closed Cluster Diagram
- #16:9
- #price quality matrix diagram
- #4-quadrant matrix PowerPoint
- #pricing strategy slide
- #market positioning diagram
- #business strategy PPT slide
About the Product
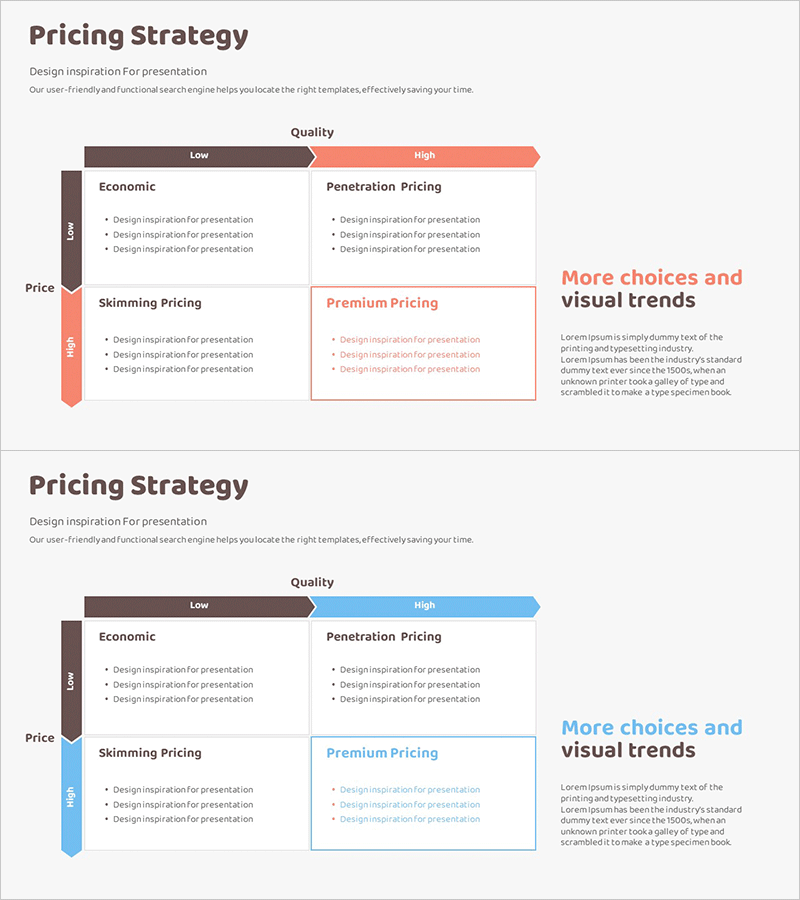
A PowerPoint slide that visualizes the relationship between price and quality using a 2×2 matrix framework. Divided into four quadrants—Economic, Penetration, Skimming, and Premium—this diagram clearly presents competitive positioning and pricing strategy. Color-coded with brown, coral, and blue tones, featuring directional arrows and text boxes that emphasize each strategy's characteristics. Ready to use in business presentations, marketing plans, and strategic reports. The 2-slide set offers multiple color combinations for flexible brand customization.
Usage Points
-
Main Usage
Analyze corporate pricing strategy and quality positioning using a 2×2 matrix framework to communicate market positioning clearly. The four strategic options—Economic, Penetration, Skimming, and Premium—are displayed at a glance, supporting decision-making for executives, marketing teams, and sales departments.
-
How to Use
Insert into marketing plans, business strategy presentations, or competitive analysis reports in the pricing strategy section. Customize the text and bullet points for your company's situation, and adjust colors to match brand guidelines. The 2-slide version provides multiple color scheme options to choose from.
-
Recommended For
Marketing professionals, strategic planning teams, executives, consultants, MBA students, and startup founders presenting pricing strategy, market positioning, or competitive analysis. Particularly effective for new product launches, price repositioning, and market entry strategy discussions.
-
Slide Structure
Two-slide set featuring brown-coral and blue color versions. Each slide displays a horizontal arrow indicating the Quality axis (Low→High) and a vertical arrow showing the Price axis (Low→High), dividing the space into four quadrants. Text boxes and bullet points in each quadrant allow you to add detailed strategy descriptions and supporting information.
Related Products
-

Asset Management Pricing Strategy Slide – Business Strategy and Pricing
#Business Strategy #Marketing Plan and Strategy #Diagram
-

Setting a Sales Pricing Strategy – Effective Business Management
#Business Strategy #Marketing Plan and Strategy #Diagram
-

Space Business Goal Closure Diagram – Visualization of Strategic Goals
#Business Vision and Strategy #Business Strategy #Diagram
-

Science Experiment Goal Arrow Diagram – Steps for Successful Projects
#Business Introduction #Business Vision and Strategy #Business Strategy
