SWOT Analysis Process Diagram – Analysis and Strategy
RM0100016_23
- Last Update 01/30/2025
- File Size 0.3MB
- # of Slides 2
- File Format PPTX
- Slide Ratio 16:9
- Color
Keywords
- #Content-Based Slides
- #Design-Based Slides
- #Market and Competitor Analysis
- #Diagram
- #SWOT Analysis
- #Market Analysis
- #Cluster
- #Closed Cluster Diagram
- #16:9
- #SWOT analysis diagram PowerPoint
- #SWOT analysis slide template
- #four-section business strategy diagram
- #competitive analysis presentation template
- #strategic planning PowerPoint slide
About the Product
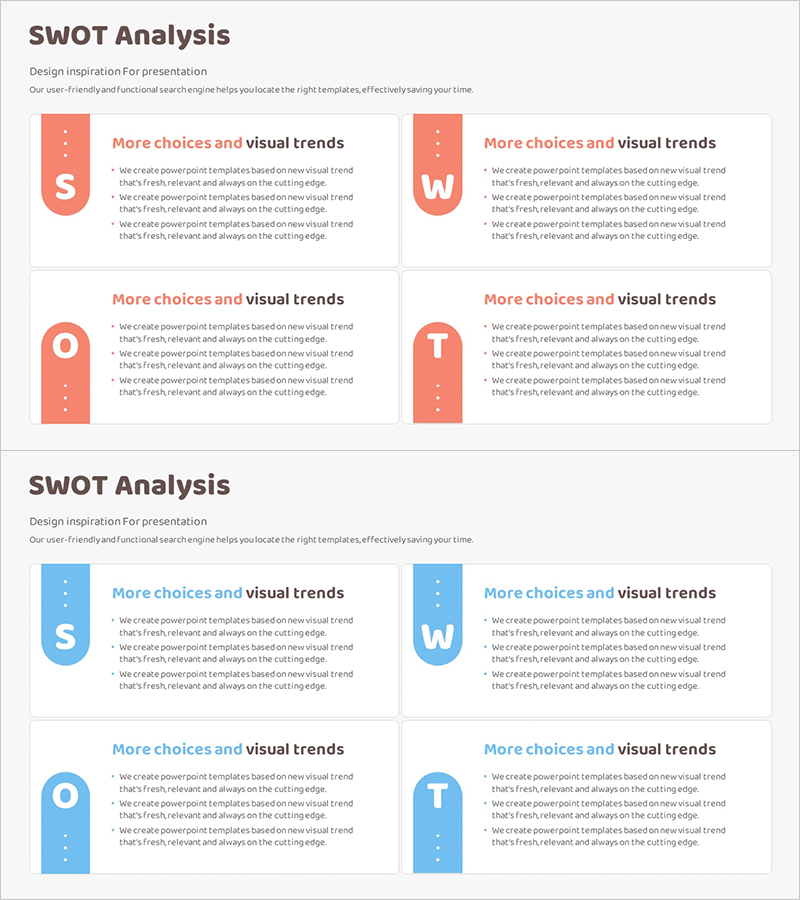
A four-section closed-form SWOT analysis diagram PowerPoint slide designed for strategic business planning and competitive analysis. This presentation template clearly separates Strengths, Weaknesses, Opportunities, and Threats into distinct quadrants, enabling teams to visualize market positioning and internal capabilities effectively. Available in two color schemes—coral red and sky blue—each section accommodates text and icons for intuitive data presentation. The 16:9 widescreen format includes 2 fully editable slides in PPTX format, ready for immediate customization and professional deployment in executive briefings and strategic planning sessions.
Usage Points
-
Main Usage
Systematically analyze and visualize a company's internal strengths and weaknesses alongside external opportunities and threats. This strategic assessment tool is essential for executive reports, business plan presentations, and marketing strategy sessions where objective situational evaluation and future direction decisions are required.
-
How to Use
Input relevant items into each of the four quadrants (S, W, O, T), then enhance visual impact by adding icons or images. Select the color scheme that aligns with corporate branding guidelines, adjust fonts and sizing, and finalize as a polished presentation asset.
-
Recommended For
Strategic planning teams, marketing managers, executives, management consultants, and business development professionals conducting quarterly business reviews, new market entry planning, strategic initiative launches, and competitive positioning assessments.
-
Slide Structure
Two slides with identical layout structure featuring four closed-form quadrants (S, W, O, T) centered on each slide. The first slide uses a coral red color palette while the second employs sky blue tones. Each quadrant includes independent text input areas and designated icon placement zones for flexible content customization.
Related Products
-

SWOT Analysis List Slide – Innovative Visualization
#Market and Competitor Analysis #Diagram #SWOT Analysis
-

SWOT Analysis Circular Slice Diagram – Market and Competitor Analysis
#Market and Competitor Analysis #Diagram #SWOT Analysis
-

Square Segment SWOT Analysis Diagram
#Market and Competitor Analysis #Diagram #SWOT Analysis
-

SWOT Analysis Table – Effective Market Analysis Tool
#Market and Competitor Analysis #Diagram #SWOT Analysis
