System Technology Configuration Diagram – A Structural Understanding Graphic
RM0100016_21
- Last Update 01/30/2025
- File Size 0.3MB
- # of Slides 2
- File Format PPTX
- Slide Ratio 16:9
- Color
Keywords
- #Content-Based Slides
- #Design-Based Slides
- #Company Introduction
- #Technical Approach
- #Diagram
- #Organizational Chart
- #System Architecture Diagram
- #Structure
- #Tree Diagram
- #16:9
- #tree diagram PowerPoint
- #hierarchical structure slide template
- #system architecture diagram
- #organizational chart PPT
- #3-level hierarchy presentation slide
About the Product
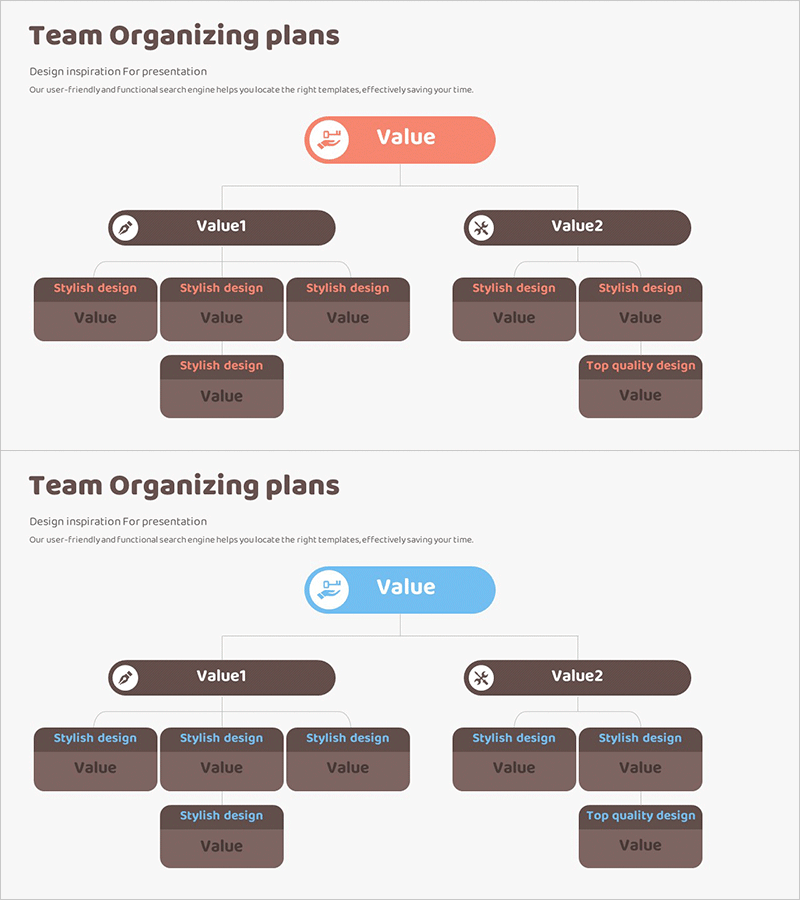
A tree diagram PowerPoint slide that hierarchically represents system technology configuration and organizational structure. Starting from a central core value node at the top, the diagram branches into two main categories, each expanding into 3-4 detailed sub-items across three levels. The design uses a harmonious coral pink and brown color palette to clearly distinguish hierarchical relationships, with icons placed at each node to enhance information clarity. This presentation slide effectively visualizes organizational charts, technology stacks, process hierarchies, and structural information in an intuitive manner.
Usage Points
-
Main Usage
Optimized for explaining system architecture, organizational structures, technology stacks, and process hierarchies in a hierarchical format. The diagram clearly visualizes step-by-step branching from top-level concepts to detailed sub-items, making complex information intuitive and easy to understand.
-
How to Use
Use this slide in technical presentations, system design documentation, organizational restructuring announcements, and product feature categorization. Edit the text in each node to match your content, and freely customize colors and icons to align with your presentation theme.
-
Recommended For
Recommended for IT professionals, system architects, organizational development managers, product strategists, and educators who need to explain structural information clearly. Ideal for technology seminars, executive briefings, onboarding training, and product launch presentations.
-
Slide Structure
The diagram features a central core value node (coral pink circle) at the top, branching into two main categories (Value1, Value2). Each main branch expands into sub-items: 3 nodes on the left branch and 2 on the right, creating a total of 7 terminal nodes across three hierarchical levels. Vertical lines connect the hierarchical relationships, with icons integrated at each node.
Related Products
-

Corporate Representative Silhouette Organization Chart – Stylish Presentation
#Company Introduction #Technical Approach #Diagram
-

Company Organization Chart Diagram – Systematic and Clear Information Delivery
#Company Introduction #Technical Approach #Diagram
-

Company Profile Organization Chart Diagram – Modern and Organized Visual
#Company Introduction #Technical Approach #Diagram
-

Modern Simple Organizational Chart Diagram – Clear Visualization of Technical Structure
#Company Introduction #Technical Approach #Diagram
