Ringer Shape Subdivided Column Graph – Intuitive Data Visualization
RM0100008_23
- Last Update 01/27/2025
- File Size 0.3MB
- # of Slides 2
- File Format PPTX
- Slide Ratio 16:9
- Color
Keywords
About the Product
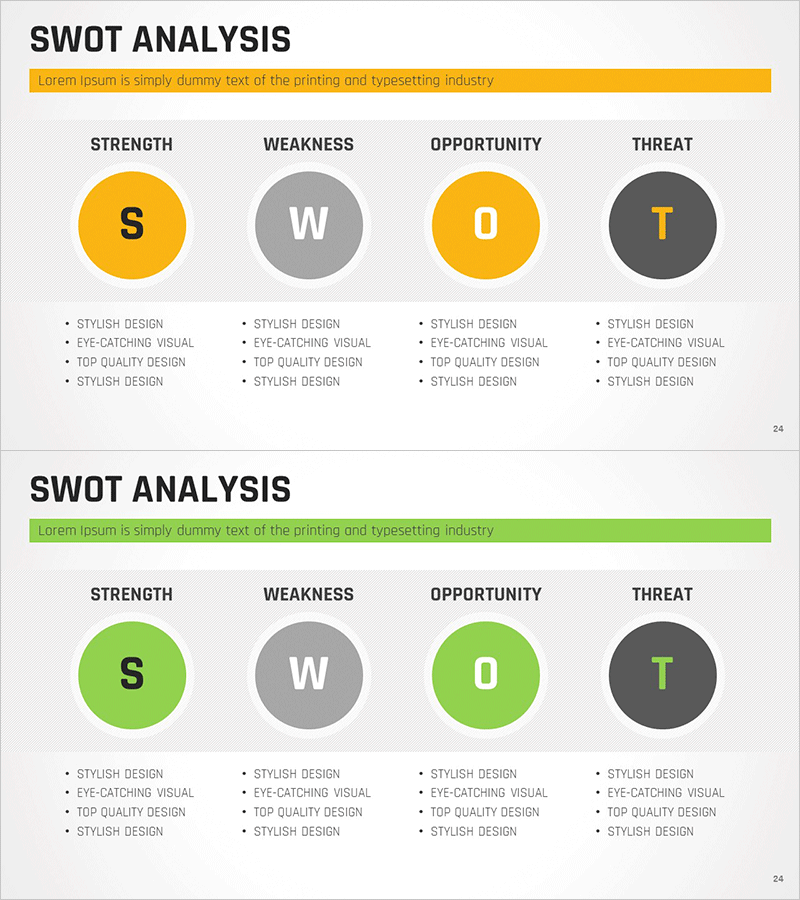
A ringer-shaped subdivided column graph PowerPoint slide designed for SWOT analysis, business evaluation, and multi-metric comparison. This presentation template uses four color-coded series—yellow, green, gray, and black—to simultaneously visualize strengths, weaknesses, opportunities, and threats with detailed indicators for each category. The combination of circular nodes and vertical bars effectively represents data hierarchy and is ready to use in strategy presentations, executive reports, and business planning documents. The 2-slide set offers flexible layouts for different analytical contexts.
Usage Points
-
Main Usage
Visualize multiple metrics and compare four dimensions simultaneously—ideal for SWOT analysis, business performance assessment, and competitive benchmarking. The color-coded series (yellow, green, gray, black) clearly distinguish strengths, weaknesses, opportunities, and threats for strategy meetings, executive briefings, and business planning presentations.
-
How to Use
Enter category names in the circular nodes and adjust bar heights and colors to match your data. Use PowerPoint's built-in shape editing tools to modify values. Additional series can be added by duplicating existing bars and adjusting colors as needed.
-
Recommended For
Executives, strategy managers, marketing teams, consultants, and project managers presenting business analysis results. Suitable for quarterly performance reviews, new business feasibility studies, and organizational capability assessments.
-
Slide Structure
2-slide set featuring a ringer-shaped subdivided column graph with four color-coded series (yellow, green, gray, black). Each slide contains four circular nodes and four vertical bar series representing different data dimensions. Optimized for 16:9 widescreen format with editable elements for custom data input.
Related Products
-

Business Expansion Strategy Flowchart for Clear Direction
#Business Introduction #Technical Approach #Diagram
-

PowerPoint Template for Service Operation Strategy Presentation
#Business Management #Operational Plan #Technical Approach
-

Rhombus Presentation Template Organization Chart – Clear and Structured Layout
#Company Introduction #Diagram #Organizational Chart
-

Middle School Curriculum Highlights – Business Vision and Strategy
#Product/Service Introduction #Business Vision and Strategy #Diagram
