CEO Chair Pictogram Structure Diagram
RM0100006_8
- Last Update 01/26/2025
- File Size 0.3MB
- # of Slides 2
- File Format PPTX
- Slide Ratio 16:9
- Color
Keywords
About the Product
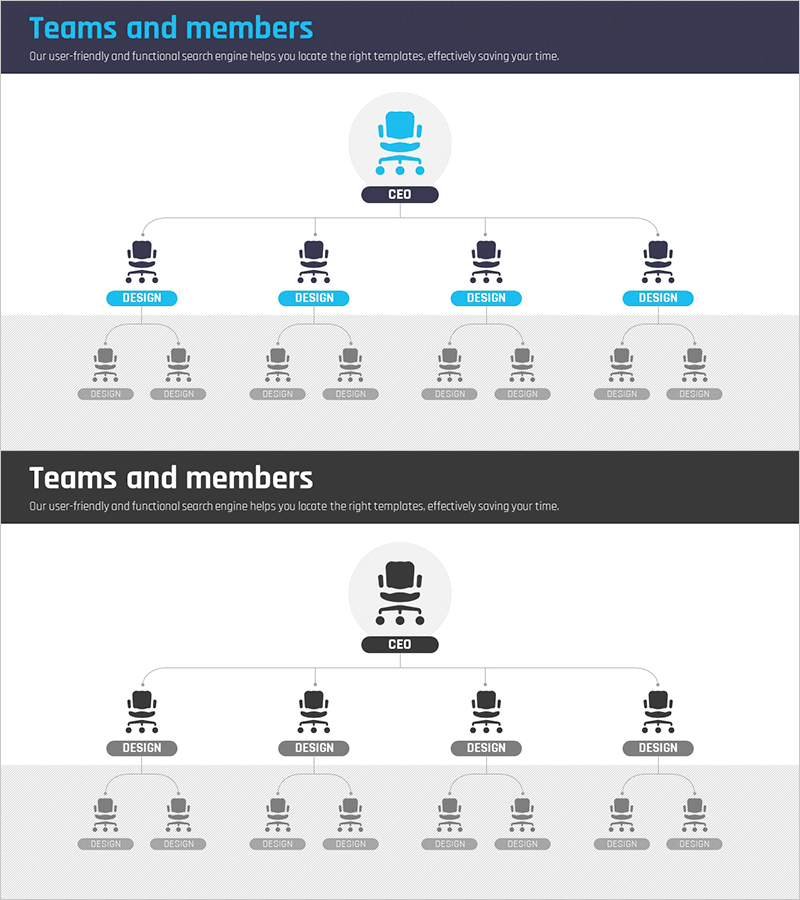
A tree diagram PowerPoint slide featuring a CEO chair pictogram representing organizational hierarchy. The structure flows from a top-level CEO node branching into four department heads (DESIGN level), with two team members beneath each department. Blue and gray color coding distinguishes hierarchical levels, while connecting lines and pictograms intuitively convey reporting relationships. Delivered in 16:9 widescreen format across 2 slides, ready for immediate use in organizational restructuring presentations, team composition introductions, and personnel structure briefings.
Usage Points
-
Main Usage
Visualizes organizational hierarchy clearly through a tree diagram structure. The CEO node at the top branches into department heads and team members, using pictograms and connecting lines to display reporting relationships and organizational lines at a glance.
-
How to Use
Apply to organizational restructuring announcements, new employee orientation sessions explaining company structure, personnel organization chart distribution, and team composition introduction presentations. Edit node text and colors to reflect actual department names, job titles, and headcount.
-
Recommended For
HR and personnel departments, executive briefing materials, new hire training resources, organizational restructuring announcements, and company overview presentations requiring organizational structure sections. Customizable for organizations ranging from small businesses to large enterprises.
-
Slide Structure
Slide 1: Top-level CEO pictogram (blue) → middle-level 4 DESIGN department head nodes (blue) → bottom-level 8 team member nodes (gray) in 3-tier hierarchy. Slide 2: Alternative layout or expanded organizational structure. Connecting lines indicate superior-subordinate relationships; pictograms distinguish job levels.
Related Products
-

Computer Company Introduction Slides - Organizational Chart Diagram
#Company Introduction #Diagram #Organizational Chart
-

Organizational Chart Diagram – Clear Structure Presentation
#Company Introduction #Diagram #Organizational Chart
-

Visualizing Organizational Structure with Business System Architecture
#Company Introduction #Technical Approach #Diagram
-

Business Work System Organization Chart – Maximizing Efficiency Structure
#Company Introduction #Technical Approach #Diagram
