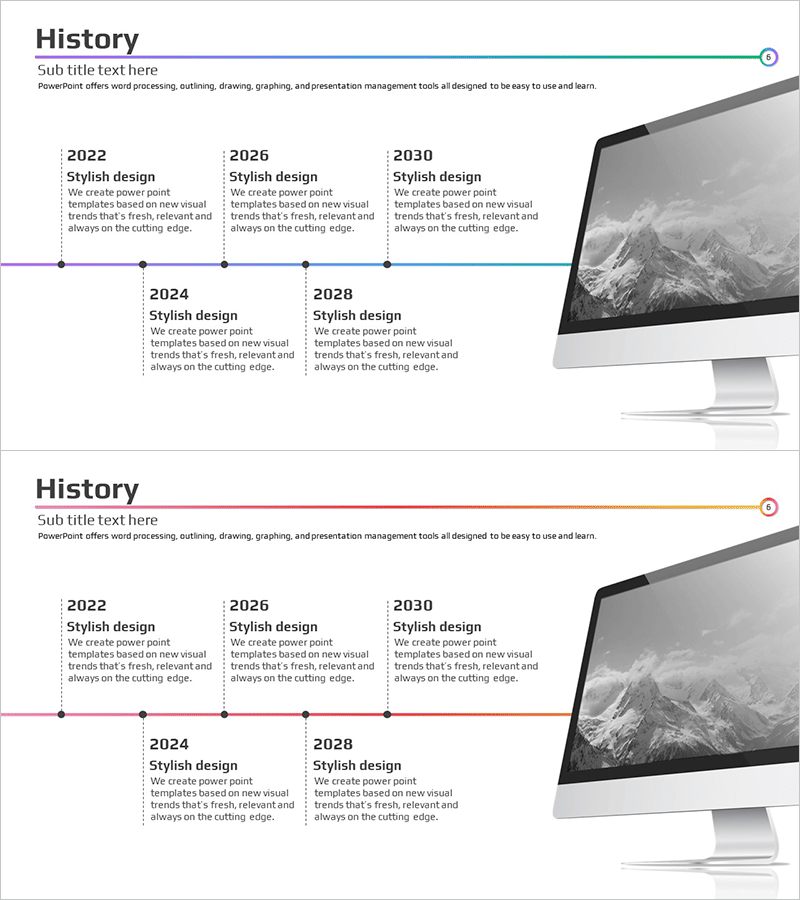
PC Mockup History Diagram – Capturing Company History and Growth
RM0100005_5
- Last Update 01/26/2025
- File Size 0.5MB
- # of Slides 2
- File Format PPTX
- Slide Ratio 16:9
- Color
Keywords
About the Product
A professional PC mockup history timeline diagram PowerPoint slide designed to showcase your company's evolution and key milestones. This 2-slide presentation template features a horizontal timeline with 5 year markers, each with dedicated text areas for milestone descriptions. Connected circular nodes and linking lines visualize the progression of time, while a desktop monitor mockup on the right emphasizes digital transformation and technological growth. The slide deck is ready to use in company overview presentations, investor pitches, and corporate history sections of any business presentation.
Usage Points
-
Main Usage
Effectively communicate your company's founding story, major milestones, and growth trajectory through a visual timeline format. The integrated PC monitor mockup symbolizes digital innovation and technological advancement, making it ideal for tech-forward organizations and growth-focused narratives.
-
How to Use
Insert this slide into the company overview or corporate history section of your presentation. Replace placeholder text with your company's actual milestones, product launches, or achievement dates. Customize colors to match your brand guidelines and adjust the timeline to fit your company's specific history span.
-
Recommended For
Perfect for company introduction presentations, investor relations (IR) decks, corporate anniversary events, employee onboarding materials, and corporate brochures. Especially effective for technology companies, startups, and organizations emphasizing digital transformation and innovation.
-
Slide Structure
Two-slide template featuring a horizontal timeline with 5 year-marker nodes arranged sequentially. Each node includes a circular icon connected by linking lines to show temporal progression. Text input areas are positioned below each milestone point for descriptions. A desktop PC mockup image is positioned on the right side to balance the overall composition and reinforce the digital growth narrative.
Related Products
-

Patent Status & Timeline Slide – Visualizing Future Business
#Company Introduction #Diagram #Other
-

Fountain Pen History Diagram – A Glimpse into Business
#Company Introduction #Business Management #Diagram
-

History Connection Diagram – Visualizing Historical Flow
#Company Introduction #Diagram #History
-

Company History Mini Diagram – Clear and Concise Timeline
#Company Introduction #Diagram #History
