SWOT Analysis Diagram – Identify Market Opportunities and Threats
RM0100005_23
- Last Update 01/25/2025
- File Size 0.3MB
- # of Slides 2
- File Format PPTX
- Slide Ratio 16:9
- Color
Keywords
About the Product
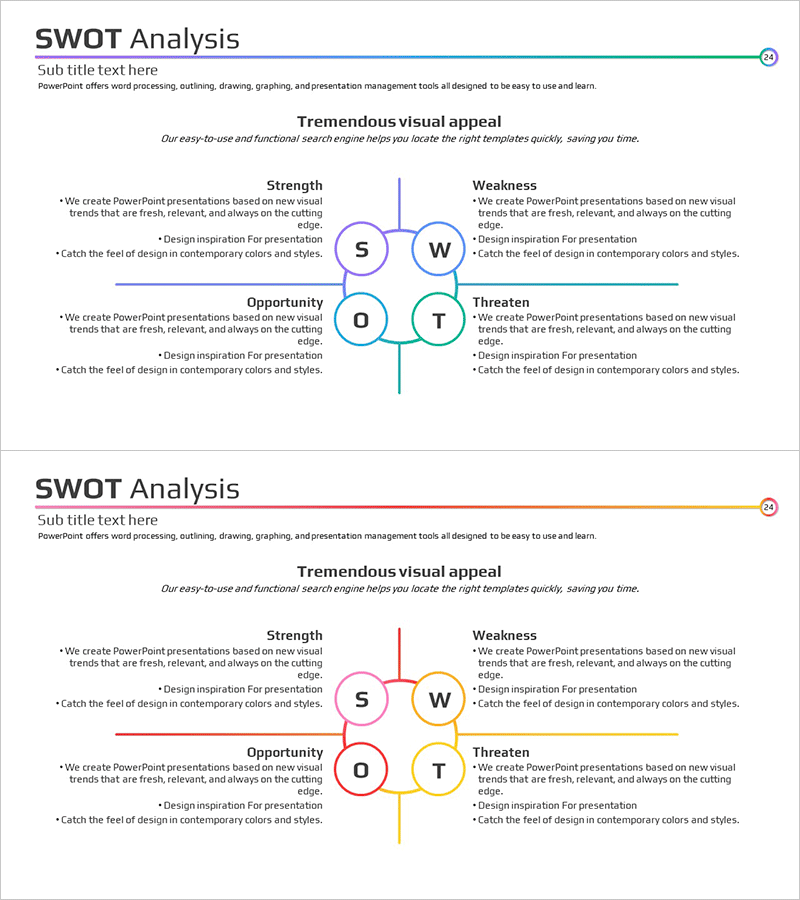
A SWOT analysis diagram PowerPoint slide that systematically identifies market opportunities and threats. This presentation template features four key areas—Strength (S), Weakness (W), Opportunity (O), and Threat (T)—arranged as circular nodes connected to a central axis structure. Each quadrant is color-coded in teal, red, orange, and yellow for clear visual distinction, with dedicated text areas for detailed content input. Ideal for executive reports, business strategy presentations, and marketing planning decks where competitive environment analysis needs to be communicated effectively. Two design variations with different connection line styles are included, allowing you to select the version that best matches your presentation context.
Usage Points
-
Main Usage
Used during strategic planning phases to simultaneously analyze and visualize internal strengths and weaknesses alongside external opportunities and threats. Effectively communicates SWOT analysis results in executive meetings, business plan presentations, and marketing strategy development sessions.
-
How to Use
Enter relevant items in each circular node (S, W, O, T) and add detailed content in the corresponding text areas on the left side. The color-coded quadrants ensure that the four strategic analysis areas are intuitively distinguished, helping audiences quickly grasp the strategic framework. Choose between two design variations based on your presentation tone and audience.
-
Recommended For
Ideal for executives, strategy managers, marketing planners, and business development professionals presenting at strategic planning meetings, quarterly business reviews, and new market entry evaluations. Commonly used in consulting firms, financial institutions, and manufacturing or service companies during strategic planning phases.
-
Slide Structure
Four circular nodes (S, W, O, T) are positioned around a central cross-axis structure. Each node is color-coded for distinction, with dedicated text input areas on the left for detailed content. Two design variations differ in connection line styles (straight vs. curved) and color emphasis methods (solid vs. gradient).
Related Products
-

Circular Gradient Template for SWOT Analysis
#Market and Competitor Analysis #Diagram #SWOT Analysis
-

Cybersecurity SWOT Analysis – Leading with Data and Insights
#Market and Competitor Analysis #Diagram #SWOT Analysis
-

SWOT Analysis Segmentation Diagram – Market and Competitive Strategy
#Market and Competitor Analysis #Diagram #SWOT Analysis
-

Square Diamond SWOT Analysis Diagram
#Market and Competitor Analysis #Diagram #SWOT Analysis
