



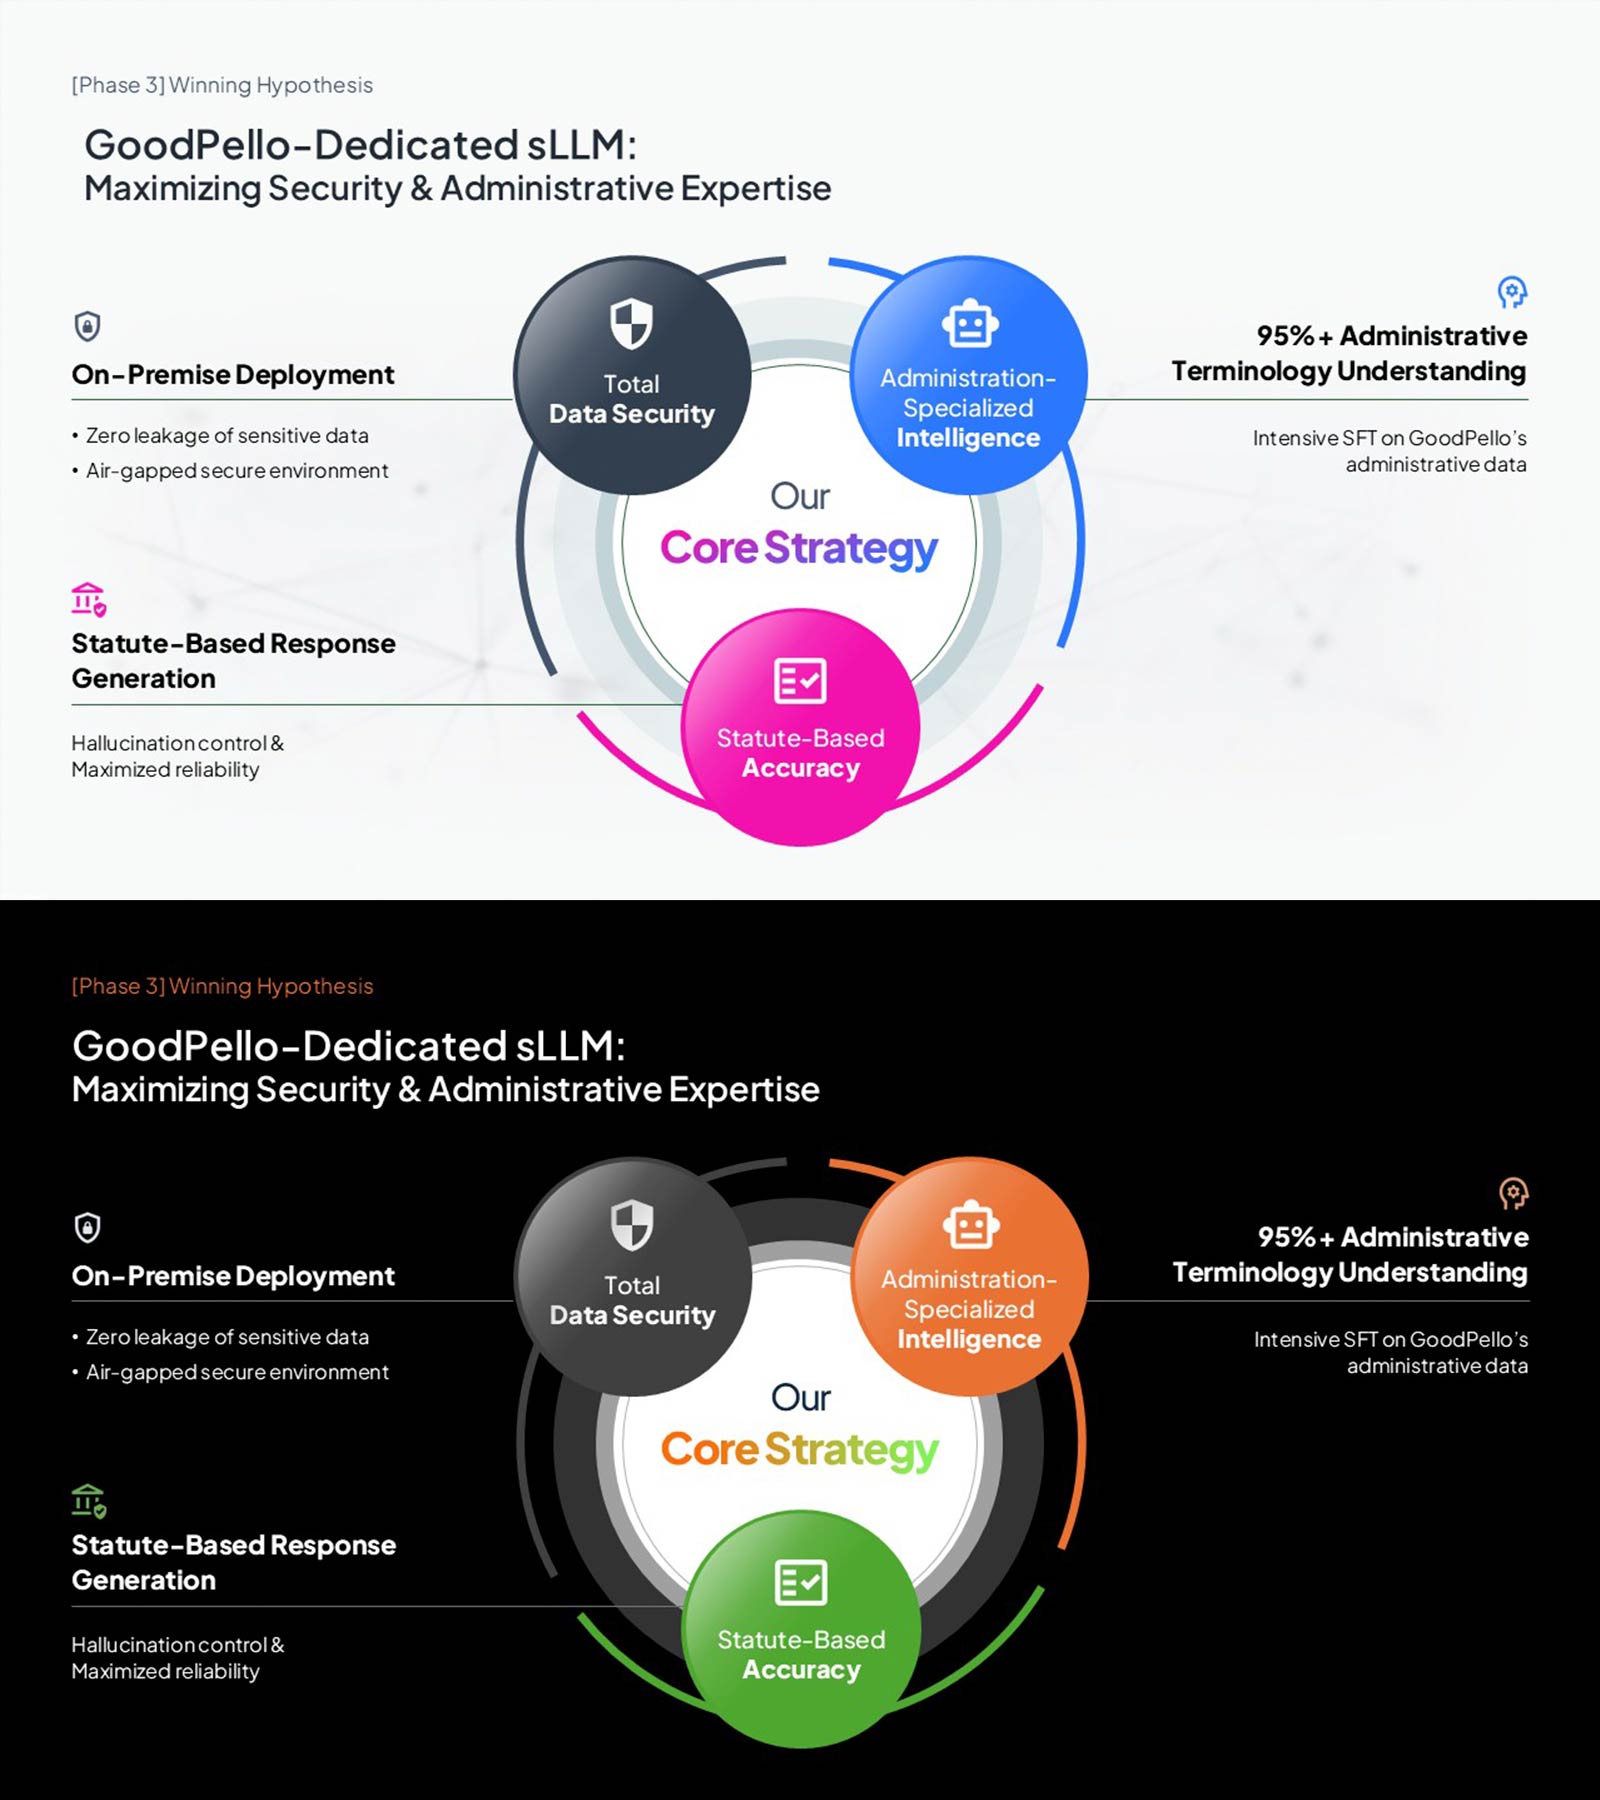
AI sLLM Core Strategy PowerPoint Slide – Venn Diagram Layout
RBTK0300002_5
- Last Update 05/04/2026
- File Size 12.9MB
- # of Slides 2
- File Format PPTX
- Slide Ratio 16:9
- Color
Keywords
- #Content-Based Slides
- #Design-Based Slides
- #Product/Service Introduction
- #Business Introduction
- #Business Vision and Strategy
- #Diagram
- #Features
- #Business Areas
- #Business Strategy
- #Cluster
- #Closed Cluster Diagram
- #16:9
- #AI sLLM strategy PowerPoint slide
- #core strategy Venn diagram presentation template
- #AI solution architecture slide deck
- #on-premise AI security PowerPoint
- #sLLM technology strategy presentation
About the Product
AI sLLM core strategy PowerPoint slide with a three-circle Venn diagram labeled Total Data Security, Administration-Specialized Intelligence, and Statute-Based Accuracy. Phase 3 headline frames the Winning Hypothesis context. Left panel covers On-Premise Deployment and Statute-Based Response Generation with bullet descriptions. Right panel highlights 95%+ Administrative Terminology Understanding. Light and dark color versions included. Editable in PowerPoint for AI startup pitch decks and investor IR presentations.
Usage Points
-
Main Usage
Use as the core technology strategy section in AI pitch decks and IR presentations. Presents three sLLM pillars—data security, specialized intelligence, and statute-based accuracy—on one PowerPoint slide.
-
How to Use
Replace the three circle labels and center headline with your strategic pillars. Edit the left panel bullet descriptions and the right panel percentage with your solution data in PowerPoint.
-
Recommended For
Ideal for AI startup founders, LLM solution teams, and enterprise technology consultants presenting AI strategy to public sector clients, investors, or executives.
-
Slide Structure
One slide. Top: Phase 3 label and headline. Center: three-circle Venn diagram (security, intelligence, accuracy). Left: two feature text blocks. Right: 95%+ KPI highlight. Light and dark versions.
Related Products
-
Business Goal Icon Diagram – An Effective Tool for Communicating Business Vision
#Business Introduction #Business Vision and Strategy #Diagram
-
Closed Diagram of Plastic Surgery
#Product/Service Introduction #Business Introduction #Diagram
-
Business Characteristics Diagram – Exceptional Product Presentation
#Product/Service Introduction #Business Introduction #Diagram
-
IT Financial Services Business Characteristics – Innovative Data Cluster
#Product/Service Introduction #Business Introduction #Diagram