Digital Twin PowerPoint Slide – Process Monitoring Dashboard
RBTK0300001_3
- Last Update 04/29/2026
- File Size 26.7MB
- # of Slides 2
- File Format
- Slide Ratio 16:9
- Color
Keywords
- #Content-Based Slides
- #Business Strategy
- #Operational Plan
- #Technical Approach
- #Achievements
- #Mitigation Measures
- #Implementation Case Studies
- #16:9
- #digital twin PowerPoint slide
- #manufacturing process optimization presentation
- #smart manufacturing monitoring PowerPoint template
- #digital twin solution presentation slide
- #manufacturing KPI dashboard PowerPoint
About the Product
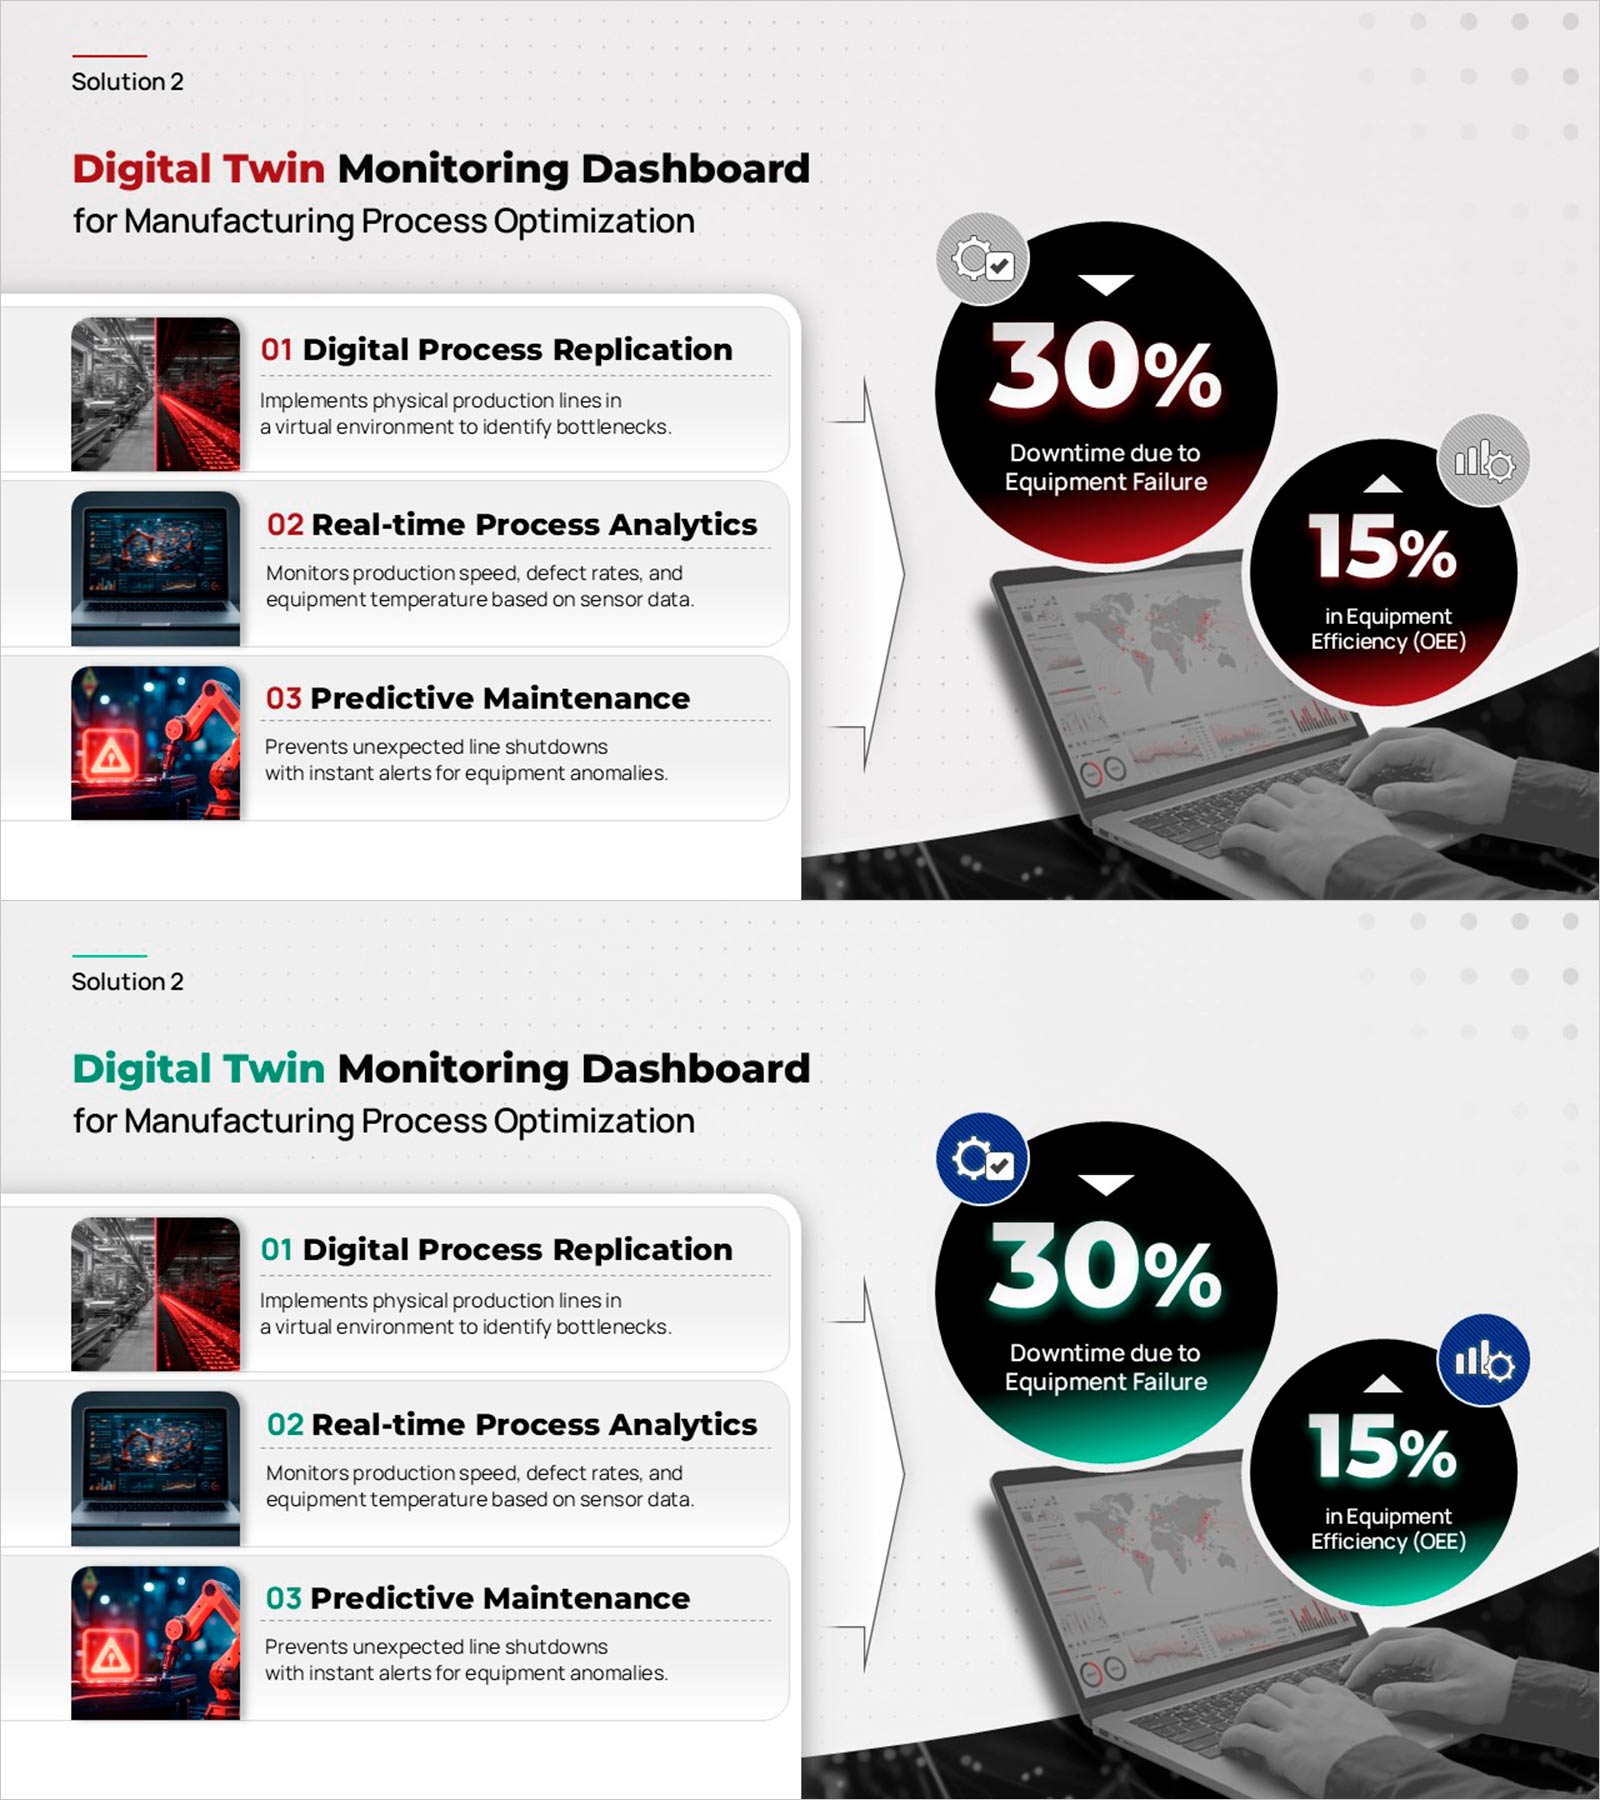
Digital twin monitoring PowerPoint slide for presenting manufacturing process optimization solutions. Left panel lists three numbered features—Digital Process Replication, Real-time Process Analytics, and Predictive Maintenance—each with a photo thumbnail and description. Right panel highlights two KPI bubbles: 30% reduction in downtime due to equipment failure and 15% improvement in equipment efficiency (OEE), overlaid on a dashboard background. Red and green versions included. Fully editable in PowerPoint for technology pitch decks, smart manufacturing presentations, and business plan solution sections.
Usage Points
-
Main Usage
Use as the technology solution showcase in smart manufacturing pitches and IT strategy decks. Presents digital twin capabilities and KPI outcomes on one structured PowerPoint slide.
-
How to Use
Replace the left panel feature titles, photos, and descriptions with your solution components. Update the KPI bubbles with your performance figures and solution headline in PowerPoint.
-
Recommended For
Ideal for tech startups, manufacturing firms, and innovation teams presenting digital twin or smart factory solutions to investors, executives, or industrial clients.
-
Slide Structure
One slide. Top: solution headline with Solution 2 label. Left: three numbered features with photo thumbnails. Right: two KPI bubbles (30%, 15%) on a dashboard background. Red and green versions.
Related Products
-

Analysis of Causes for Increase/Decrease in a Multidirectional Flow - Business Strategy
#Business Strategy #Operational Plan #Diagram
-

Analysis Table and Summary – Efficient Tool for Business Strategies
#Business Strategy #Operational Plan #Diagram
-

Core Technology & Solutions – Visualization of Risk Management
#Operational Plan #Diagram #Risk Management
-

Strategies for Empathy and Effective Dialogue – Mastering Communication Crafts
#Business Management #Operational Plan #Diagram
