Quarterly Business Report Presentation Template | 11-Slide Executive Reporting Deck for KPI, Revenue & Action Plans
BTK0200004
- Last Update 04/22/2026
- File Size 43.7MB
- # of Slides 11
- File Format PPTX
- Slide Ratio 16:9
- Color
This resource is included in the Biz Toolkit.
Download is only available to annual subscribers.
Keywords
- #Strategy Templates
- #Business/Performance Report
- #16:9
- #quarterly business report presentation template
- #executive report deck
- #business performance presentation
- #KPI report slide deck
- #quarterly performance review template
- #PowerPoint template quarterly report
- #Q1 business report slides
- #revenue and KPI presentation
- #executive summary deck
- #business results presentation template
About the Product
Quarterly Business Report Presentation Template | 11 Slides Structured for Executive Decision-Making
Why You Need This Template
Every quarter, strategy and operations teams spend hours rebuilding the same report structure from scratch — only to produce a deck that lists numbers without telling executives what to decide. This quarterly business report presentation template solves that directly. Without a clear flow from revenue summary to KPI analysis to next-quarter actions, business report presentations fail to drive the decisions they're meant to support. If your team is stuck reformatting slides instead of analyzing results, this executive report deck gives you the structure to fix that immediately.
What Makes This Deck Different
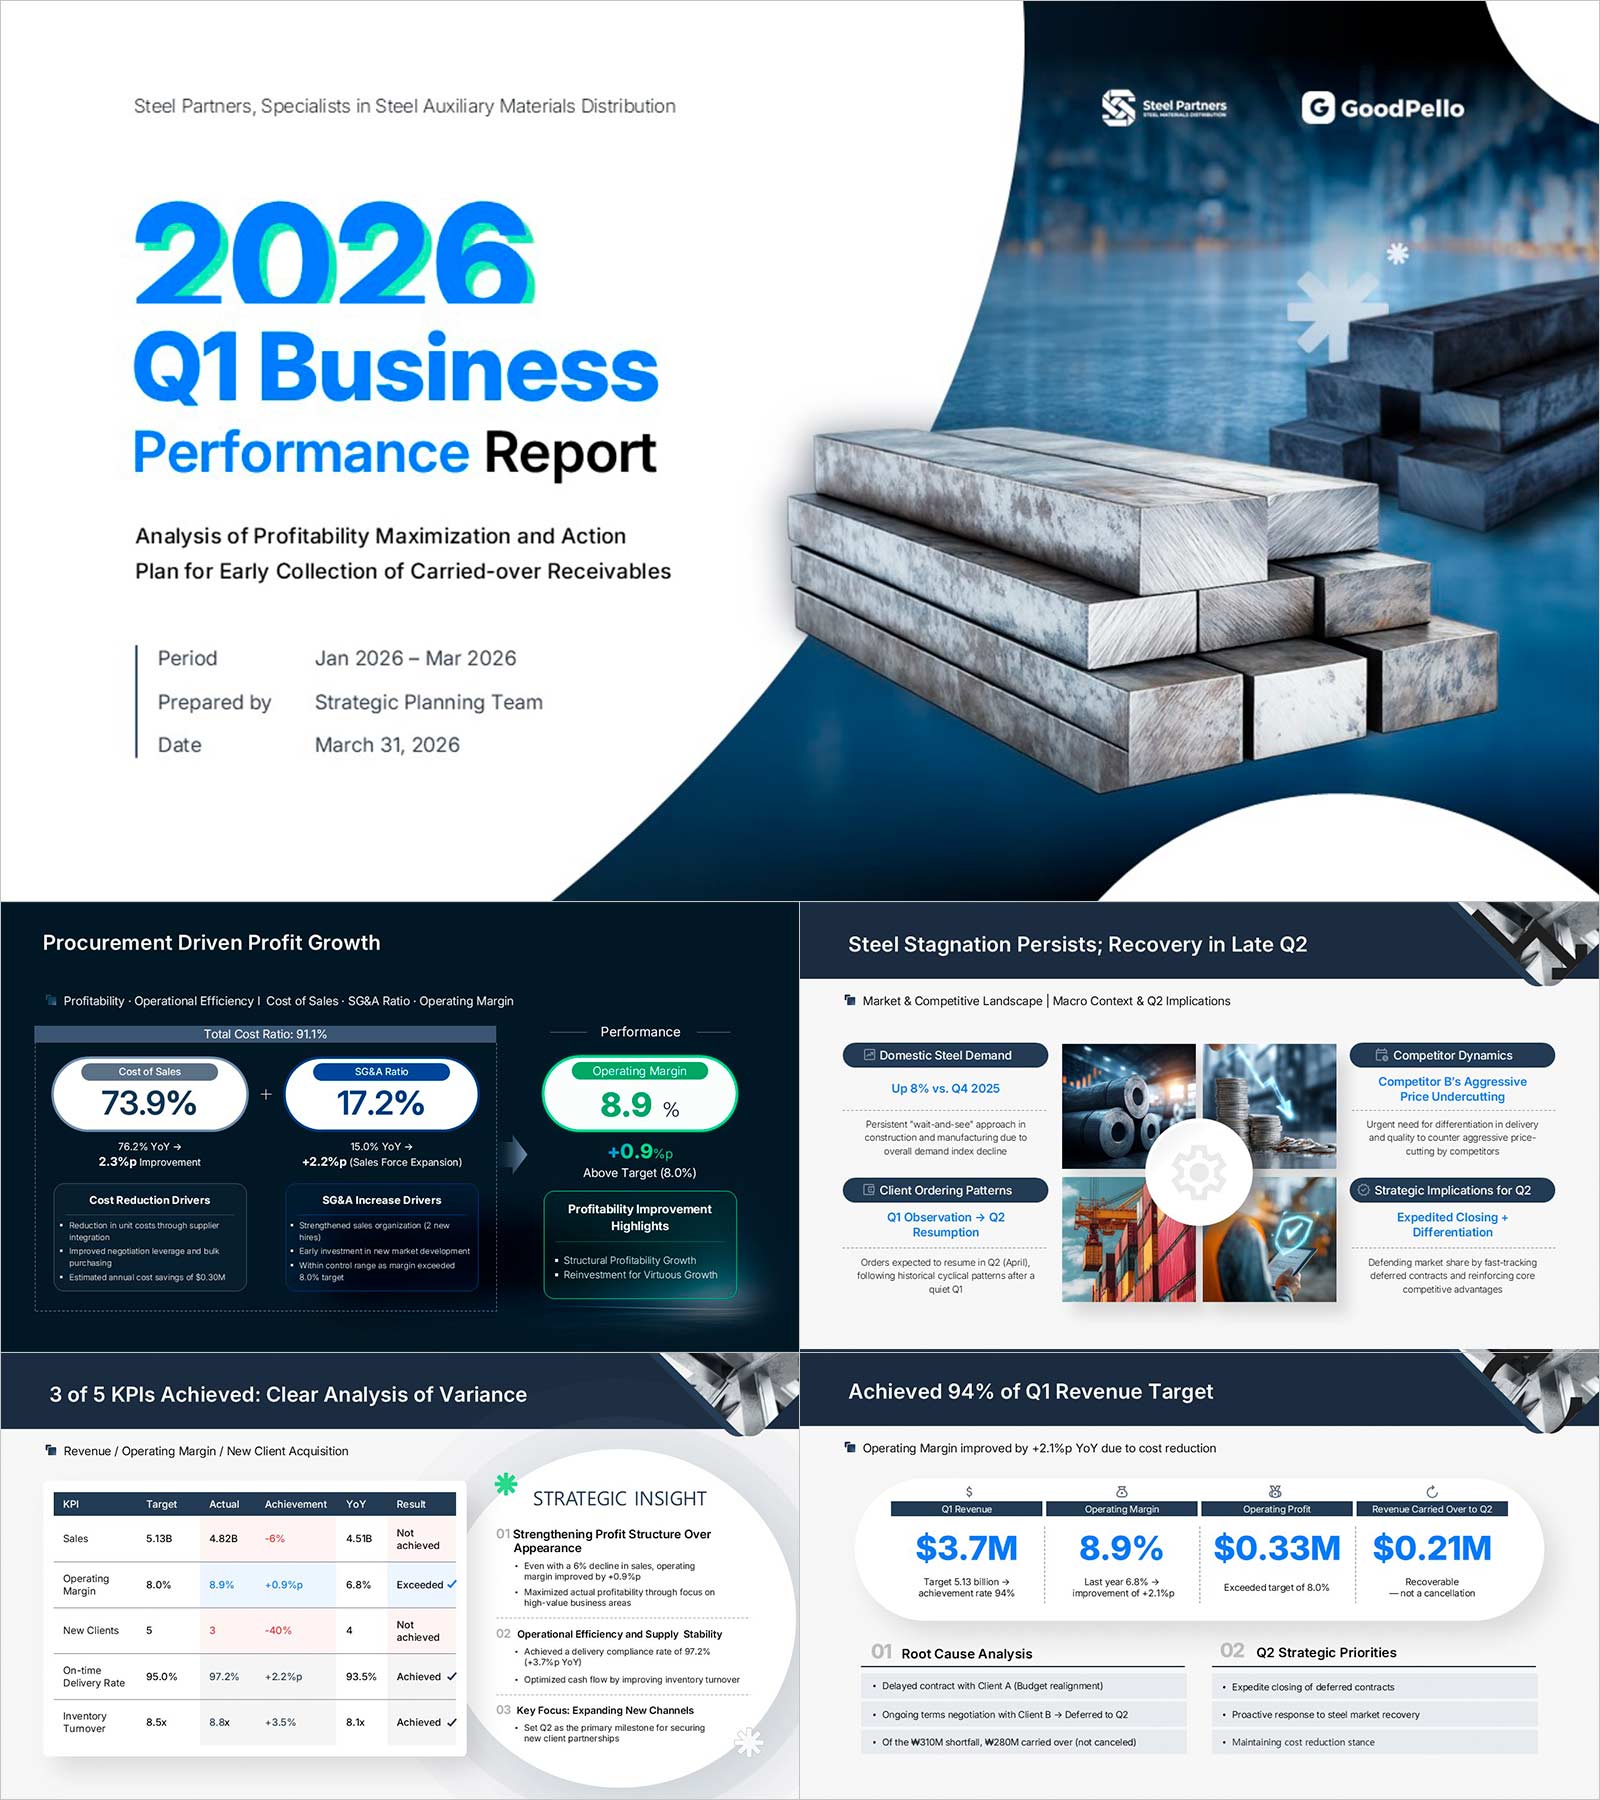
The template is built around a navy blue and accent blue color system, alternating between dark-background highlight slides and clean white data slides to maintain visual focus across the full report. The 11-slide executive report deck flows from cover and executive summary through revenue achievement, KPI plan-vs-actual comparison, profitability analysis, market environment, performance highlights, next-quarter targets, action ownership, risk management, and management decision requests — all in a single presentation. KPI scorecards, bar charts, comparison tables, and assignee-level action trackers are pre-built so you only need to fill in your numbers. This is a PowerPoint template designed for teams who report to senior leadership on a regular cadence and need a business performance presentation that holds up under scrutiny.
Usage Points
-
Main Usage
Designed for quarterly business performance reporting to executive leadership. Covers revenue achievement, KPI plan-vs-actual comparison, profitability analysis, market environment, and next-quarter action plans — all structured into a single executive report deck.
-
How to Use
The 11-slide flow is pre-built in the order executives expect: cover → performance summary → KPI analysis → root-cause breakdown → profitability review → market environment → performance highlights → next-quarter targets → action ownership → risk management → management decision requests. Fill in your numbers and content — the structure does the rest. KPI scorecards, plan-vs-actual comparison tables, bar charts, and assignee-level action trackers are already in place, so no additional design work is needed.
-
Recommended For
- Strategy planning and sales operations teams who prepare quarterly executive briefings on a regular cadence - Team leads and department managers looking to rebuild their quarterly reporting structure from scratch - Finance and CFO office teams reporting on profitability, cost structure, and procurement performance - Managers in manufacturing, distribution, or B2B services who need to report revenue targets and cost management together in a single deck
-
Slide Structure
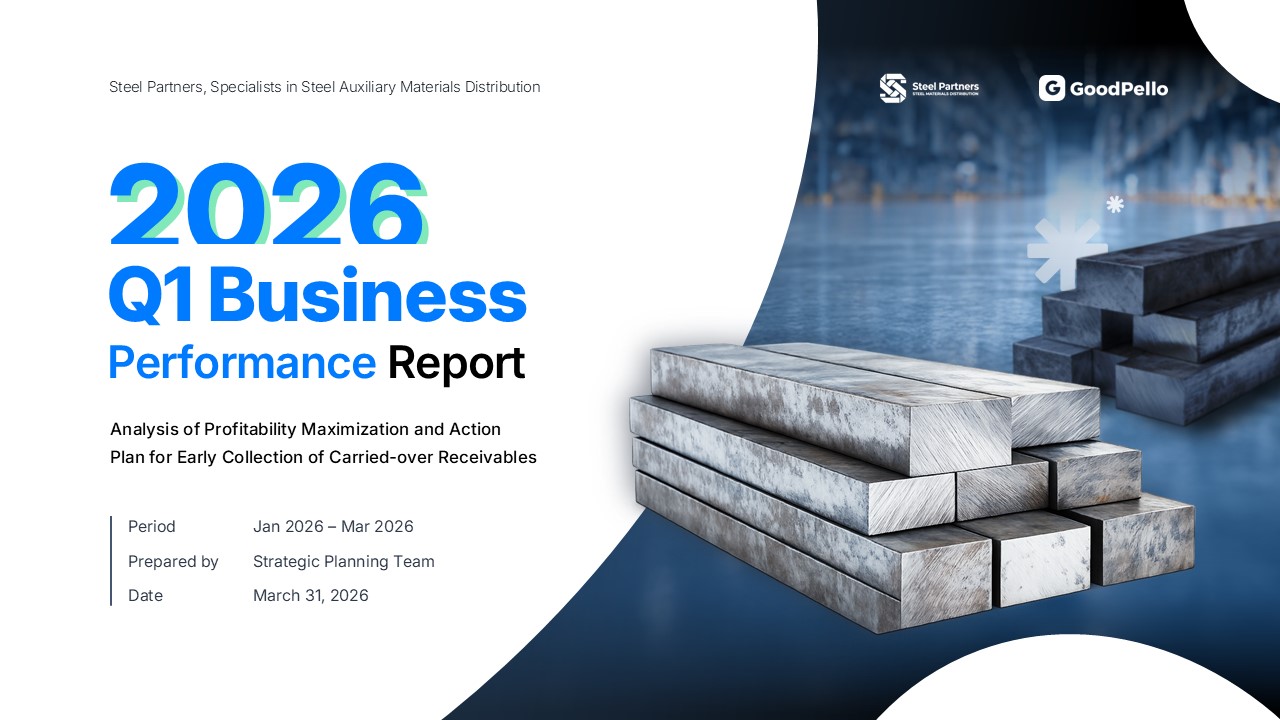
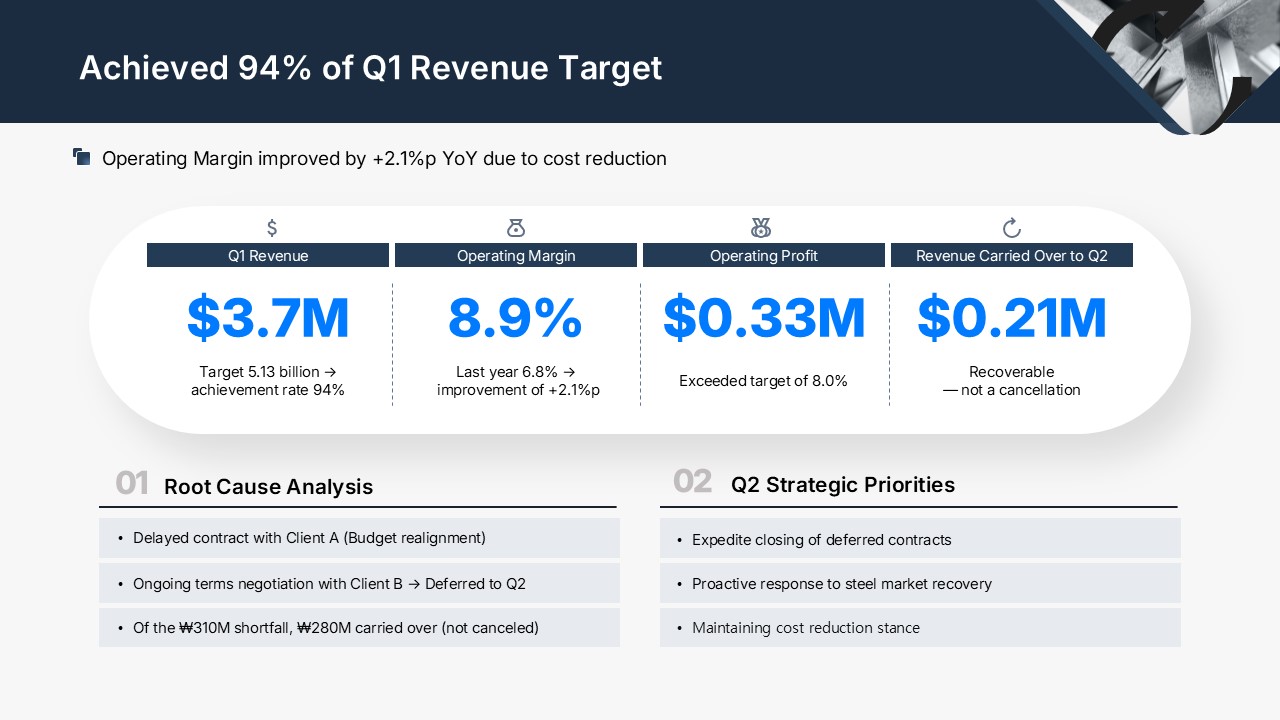
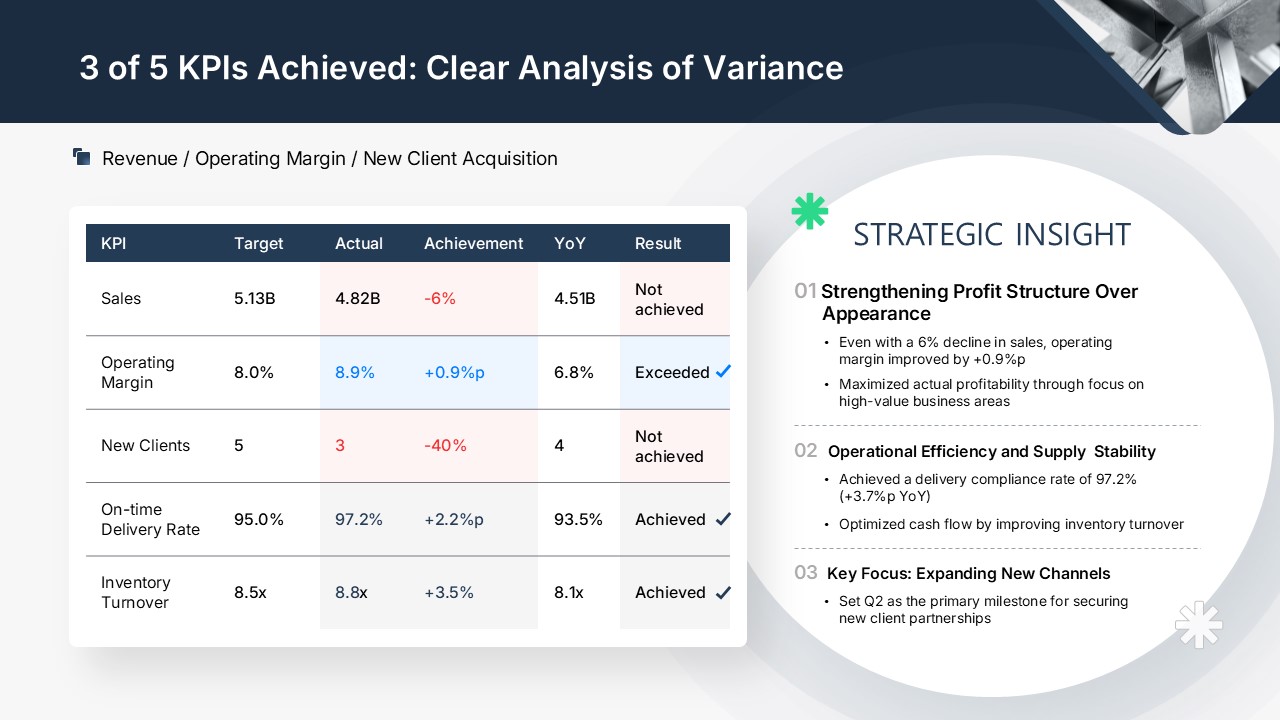
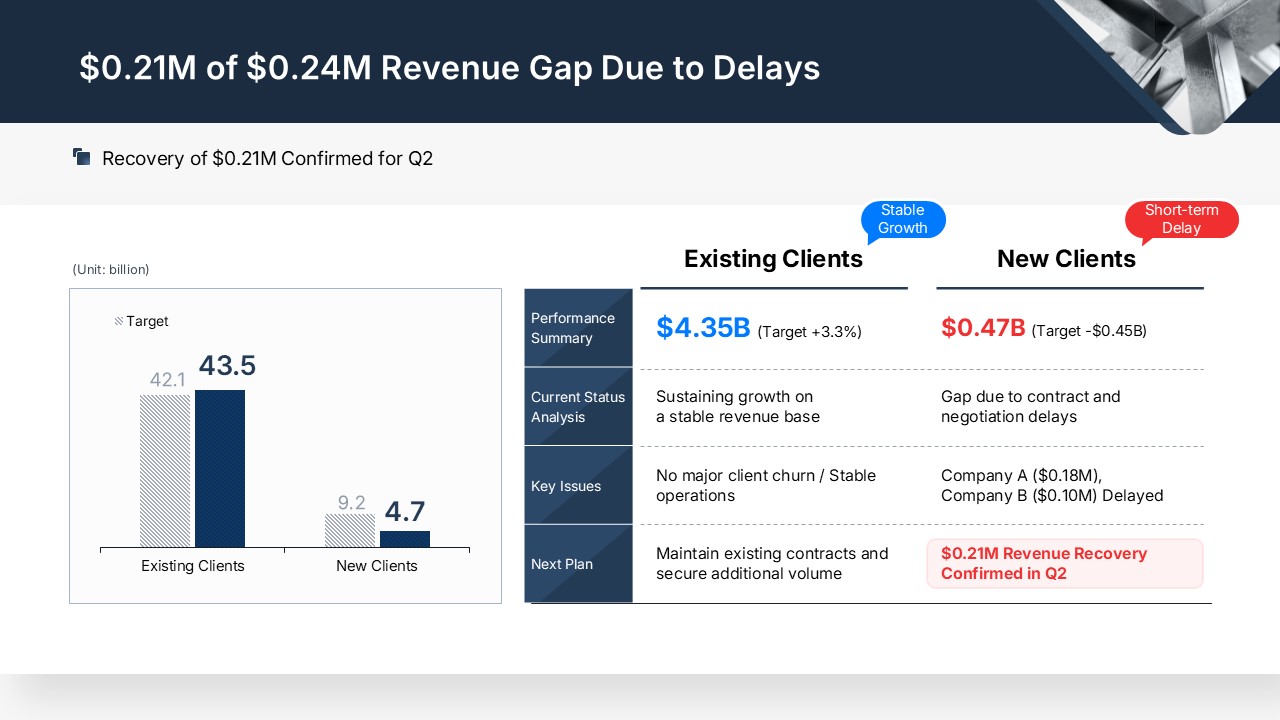
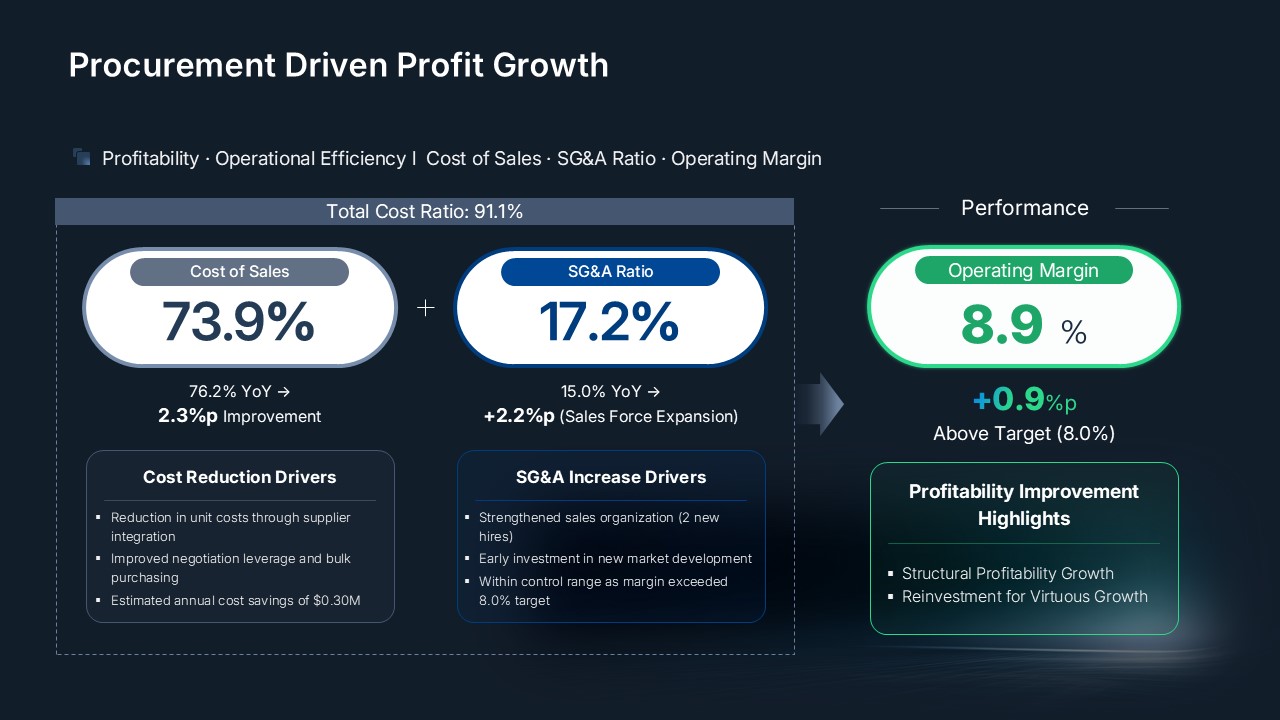
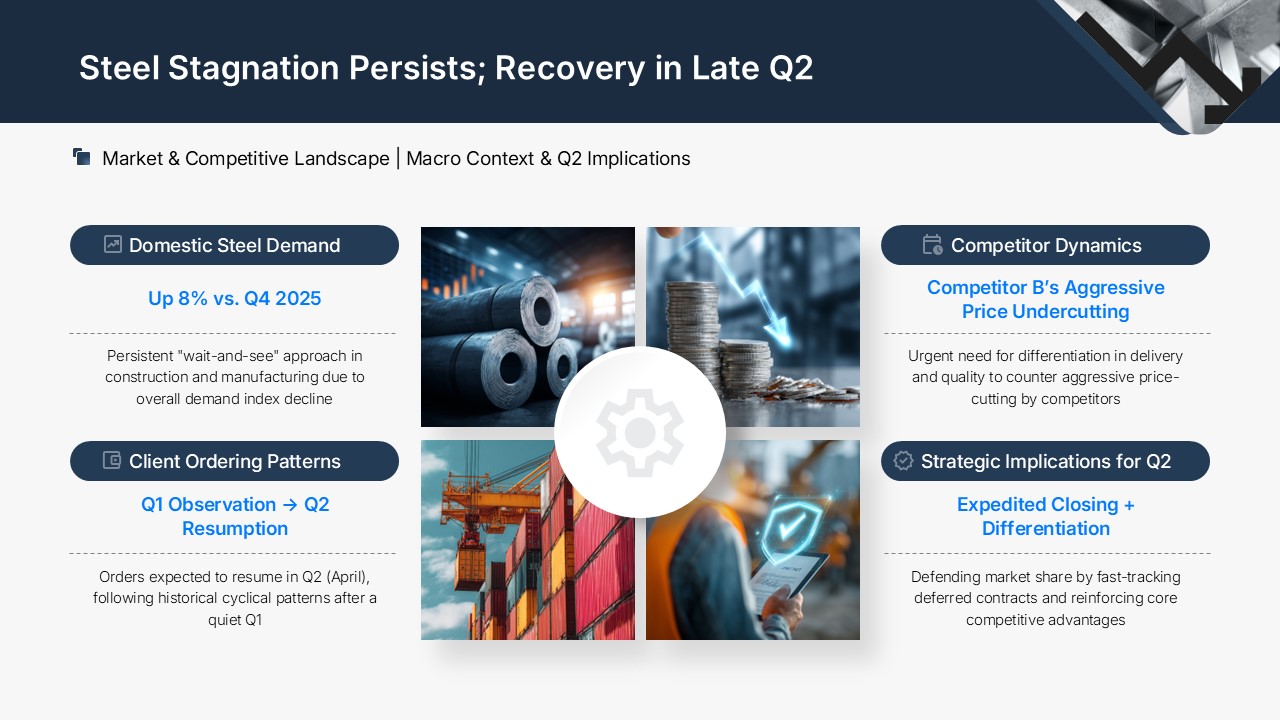
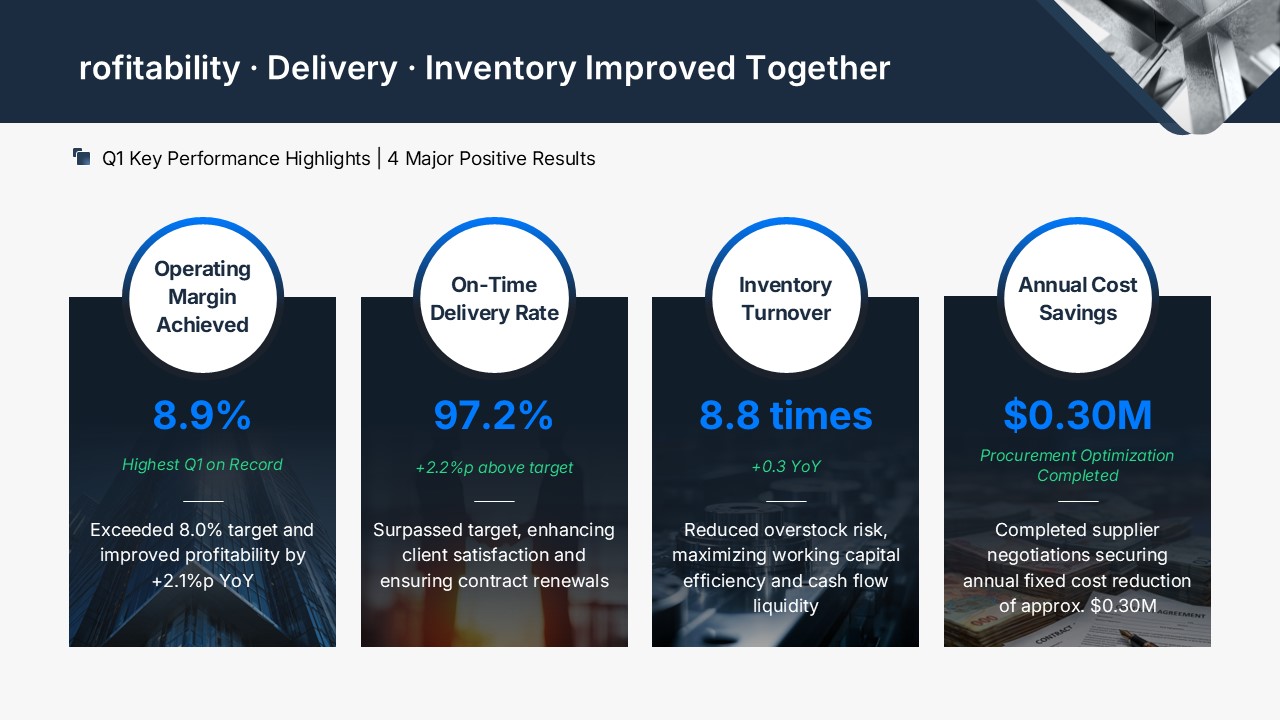
11 slides total. Cover (reporting period, department, report date) / Revenue achievement summary (4 KPI cards, shortfall causes, core tasks) / KPI plan-vs-actual comparison table with Strategic Insight (5 KPIs) / Revenue performance analysis (existing vs. new accounts, bar chart + comparison table) / Profitability and cost analysis (COGS ratio, SG&A ratio, operating margin) / Market and competitive environment with Q2 implications / Q1 performance highlights (4 positive outcome cards) / Q2 targets and 3 strategic pillars / Q2 action plan — 5 items with owner, deadline, and status / Q2 risk register — 3 risks with response framework / Q2 financial outlook and management decision requests
Related Products
-

Wave Environmental Business Report PPT Template – Stylish Green Design
#Business/Performance Report
-

Bio Healthcare Business Report PowerPoint Template – Modern and Intuitive Design
#Business/Performance Report
-

Financial Industry Trend & Strategy Report Template – Clean and Modern Design
#Business/Performance Report
-

Pet Goods Store Business Report PowerPoint Template - Vibrant Design
#Business/Performance Report
