4-Circle Overlap Diagram PowerPoint Template – Contemporary Ring Design Infographic
OD0100005
- Last Update 10/02/2025
- File Size 0.1MB
- # of Slides 2
- File Format PPTX
- Slide Ratio 16:9
- Color
Keywords
About the Product
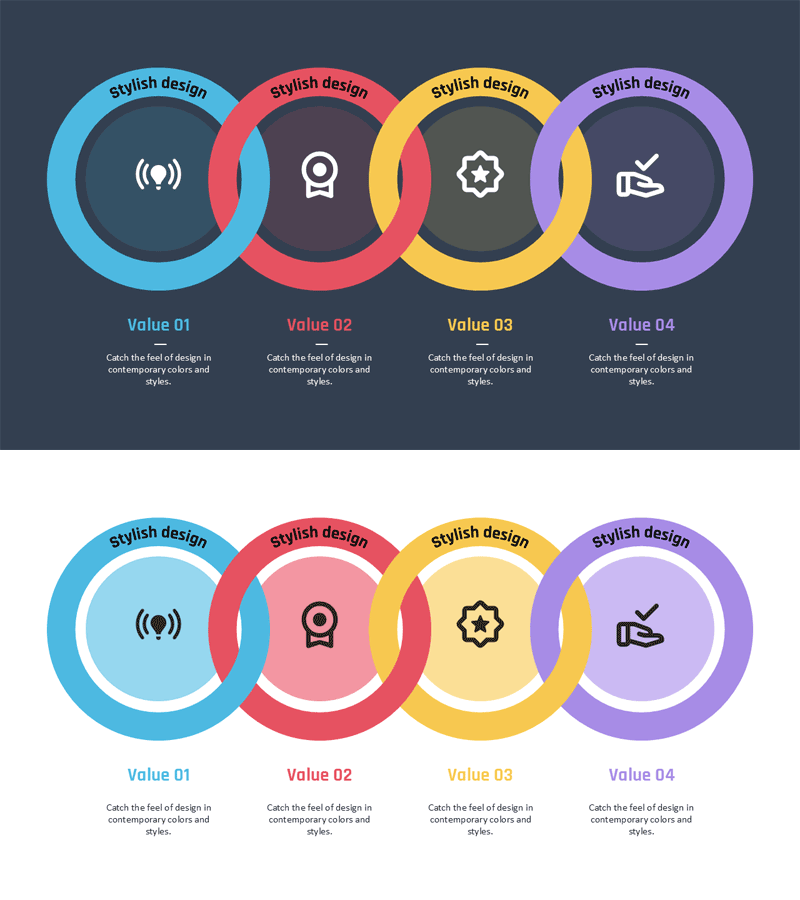
This free PowerPoint diagram slide features four overlapping ring circles in blue, red, yellow, and purple, arranged horizontally in a connected chain structure. Two color scheme versions are included: a dark navy background with white icons and a white background with dark icons, giving you flexibility to match your presentation environment. Each ring contains a curved label area at the top, a line-style icon at the center, and a title plus description text area below, providing 12 editable text points in total. The layout is ideal for presenting four parallel concepts such as core values, strategic pillars, product features, or service benefits in a visually balanced way. The 16:9 PPTX file is fully editable in PowerPoint, allowing you to replace text and swap icons without altering the overall structure. For more free diagram slides with similar ring and cluster layouts, explore the GoodPello Free Diagram section.
Usage Points
-
Main Usage
Designed to visually present four parallel items such as core values, strategic pillars, product features, or service benefits. The overlapping ring structure communicates equal weight between items while maintaining a clear, organized visual hierarchy.
-
How to Use
Replace the 12 editable text areas — curved top labels, Value titles, and description text — with your own content. Choose between the dark navy or white background version to match your presentation style, then insert the slide directly into your deck.
-
Recommended For
Best suited for business planners, marketers, startup founders, and designers who need to present four key concepts in company profiles, product presentations, marketing plans, or pitch decks. Works well for both internal reports and client-facing presentations.
-
Slide Structure
Single-slide layout with four horizontally overlapping ring circles, each containing a curved top label area, a centered line icon, and a lower title plus description text block — 12 text input points total. Provided in two versions: dark navy background and white background.
Related Products
-

Free Service Configuration Diagram Gear Diagram – Effectively Visualizing Business Flow
#Free Diagrams
-

Free Donut Chart PowerPoint Template | Soft Rounded Circular Graph Diagram
#Free Diagrams
-

Free Service 3 Step Development Plan - Flowchart for Organization and Goals
#Free Diagrams
-

Quality Assurance Plan Diagram – Step-by-Step Flow for Business Execution
#Free Diagrams
