Expected Impact and Conclusion Slide for Sustainable Urban Development
RJ0900039_6
- Last Update 12/22/2025
- File Size 0.3MB
- # of Slides 2
- File Format PPTX
- Slide Ratio 16:9
- Color
Keywords
- #Content-Based Slides
- #Design-Based Slides
- #Company Introduction
- #Business Vision and Strategy
- #Text Box
- #Core Values, Vision, and Mission
- #Business Goals
- #Spread
- #Centralized Diagram
- #Circular Text Box
- #16:9
- #three-circle diagram PowerPoint
- #connected circle diagram template
- #sustainable urban development slide
- #economic growth environmental impact PPT
- #policy report presentation
- #urban planning slide template
- #diagram PowerPoint slide design
About the Product
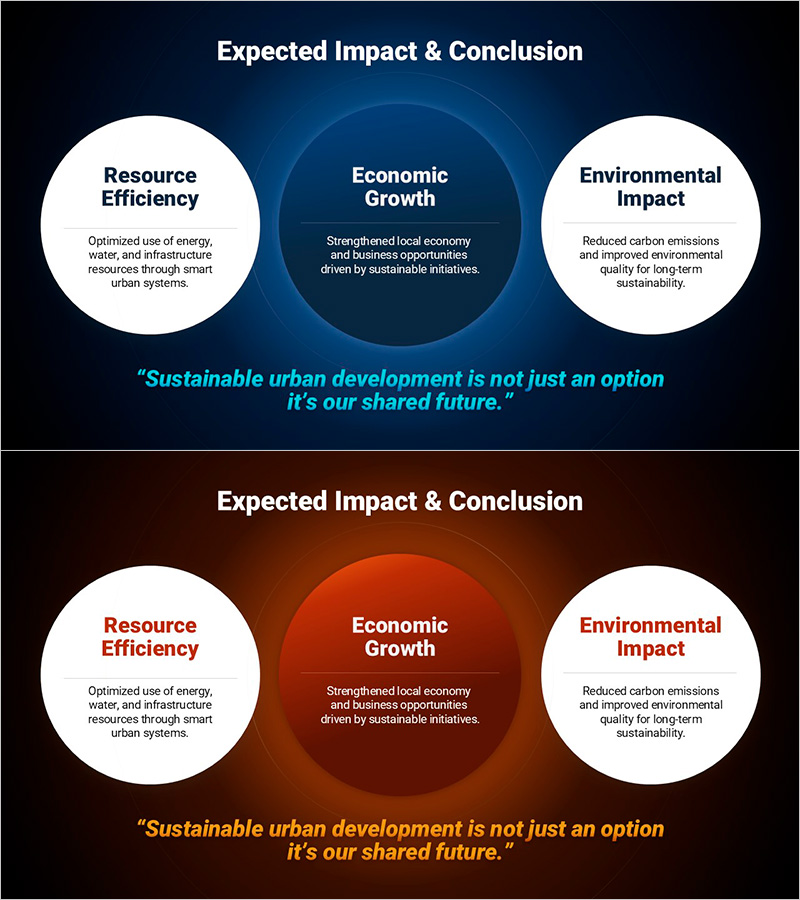
A PowerPoint slide template that visualizes the expected impact of sustainable urban development across three core dimensions: Resource Efficiency, Economic Growth, and Environmental Impact. The central Economic Growth node connects to the outer circles through glowing lines, creating a cohesive visual hierarchy ideal for policy reports, ESG presentations, and urban planning pitches. Presented in two color variations—dark blue with white nodes and dark brown with orange accents—against dark backgrounds for maximum visual impact. Fully editable PPTX format with 2 slides, 16:9 aspect ratio.
Usage Points
-
Main Usage
Systematically organize the expected outcomes of urban development, environmental policy, and ESG strategy across three interconnected dimensions—Resource Efficiency, Economic Growth, and Environmental Impact—using a circular diagram structure that emphasizes relationships and mutual dependencies.
-
How to Use
Insert this slide into policy reports, urban planning presentations, government briefings, or ESG strategy decks as a conclusion or impact summary section. Customize the text within each circle node to reflect your specific data, metrics, or strategic focus areas. The glowing connection lines automatically emphasize the integrated nature of the three dimensions.
-
Recommended For
Urban planners, environmental policy specialists, ESG report authors, government agencies, sustainability consultants, construction and real estate firms presenting strategic initiatives, and research institutions analyzing multi-dimensional policy impacts. Ideal for audiences requiring clear visualization of interconnected outcomes.
-
Slide Structure
Two-slide set featuring identical three-circle connected diagrams in contrasting color schemes: dark blue background with white nodes (emphasizing central Economic Growth), and dark brown background with orange accents (warm tone variant). Each slide contains one central circle node and two outer circle nodes connected by glowing lines, with editable text areas in each node.
Related Products
-

Circular Strategy Diagram – Effectively Communicate Vision and Mission
#Company Introduction #Product/Service Introduction #Operational Plan
-

5 Diagrams of Eco-friendly Business Strategies
#Business Vision and Strategy #Diagram #Business Strategy
-

Vision and Mission of Eco Farming Business – Message of Sustainability
#Company Introduction #Business Strategy #Diagram
-

Key Targeting Circle Diagram – Business Goal Setting
#Business Vision and Strategy #Marketing Plan and Strategy #Diagram
