Performance Metrics Slide for Space Exploration Presentations
RJ0800056_3
- Last Update 12/22/2025
- File Size 5.1MB
- # of Slides 2
- File Format PPTX
- Slide Ratio 16:9
- Color
Keywords
- #Content-Based Slides
- #Design-Based Slides
- #Company Introduction
- #Business Introduction
- #Text Box
- #Key Achievements
- #Business Overview
- #Rectangle Text Box
- #16:9
- #space exploration performance metrics PowerPoint
- #technical project KPI slide
- #data visualization presentation
- #mission success indicators slide
- #black background metrics template
About the Product
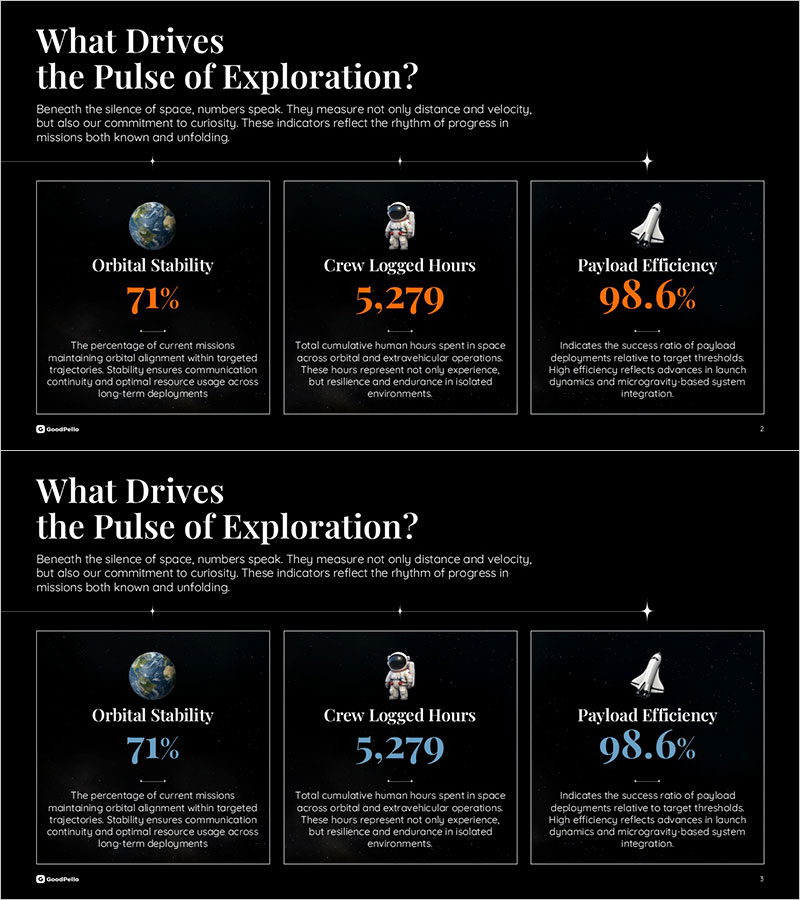
A professional PowerPoint slide visualizing three core performance metrics for space exploration projects. Displays Orbital Stability at 71%, Crew Logged Hours at 5,279, and Payload Efficiency at 98.6% against a black background with white typography and orange accent highlights. Each metric features an icon and descriptive text to clearly communicate project achievements and technical credibility. The 2-slide set includes color variations (orange and blue versions) in 16:9 PPTX format, fully editable for immediate use. Ideal for investor presentations, technical reports, and mission performance briefings.
Usage Points
-
Main Usage
Communicate quantitative mission achievements to investors and stakeholders with visual clarity. The slide presents orbital stability, cumulative operational hours, and payload efficiency as measurable success indicators, reinforcing technical credibility through black background and orange accent design.
-
How to Use
Insert into technical performance reports, aerospace project presentations, or investment pitch decks in the achievements section. Edit metric values to match your project data, and select between the two provided color variations (orange or blue) to align with your presentation's visual identity.
-
Recommended For
Technology companies, aerospace and aviation industries, government research institutions, and space agencies presenting mission results. Particularly effective for technical leadership presentations, innovation project reports, investor relations materials, and academic conference presentations requiring quantitative performance emphasis.
-
Slide Structure
The slide layout features a title area (top left) and three metric card sections arranged horizontally. Each card contains an icon (top), metric label (middle), numerical value (highlighted), and descriptive text (bottom) in a four-tier information hierarchy. Total of 12 editable text fields: title (1), metric names (3), values (3), descriptions (3), and subtitle (1).
Related Products
-

Stylish Design for Performance Presentation Slide
#Business Introduction #Business Vision and Strategy #Text Box
-

Typographic Wide Template Closed Diagram – Company Introduction and Market Analysis
#Company Introduction #Market and Competitor Analysis #Diagram
-

Concise Business Objectives Slide – Vision and Strategy
#Business Introduction #Business Vision and Strategy #Text Box
-

Head Office Slide Introducing Flagship Cafe Location
#Company Introduction #Business Introduction #Company Overview
