Marine pollution caused by plastic waste
RL0100102_3
- Last Update 11/19/2025
- File Size 16.1MB
- # of Slides 2
- File Format PPTX
- Slide Ratio 16:9
- Color
Slide Preview
Keywords
About the Product
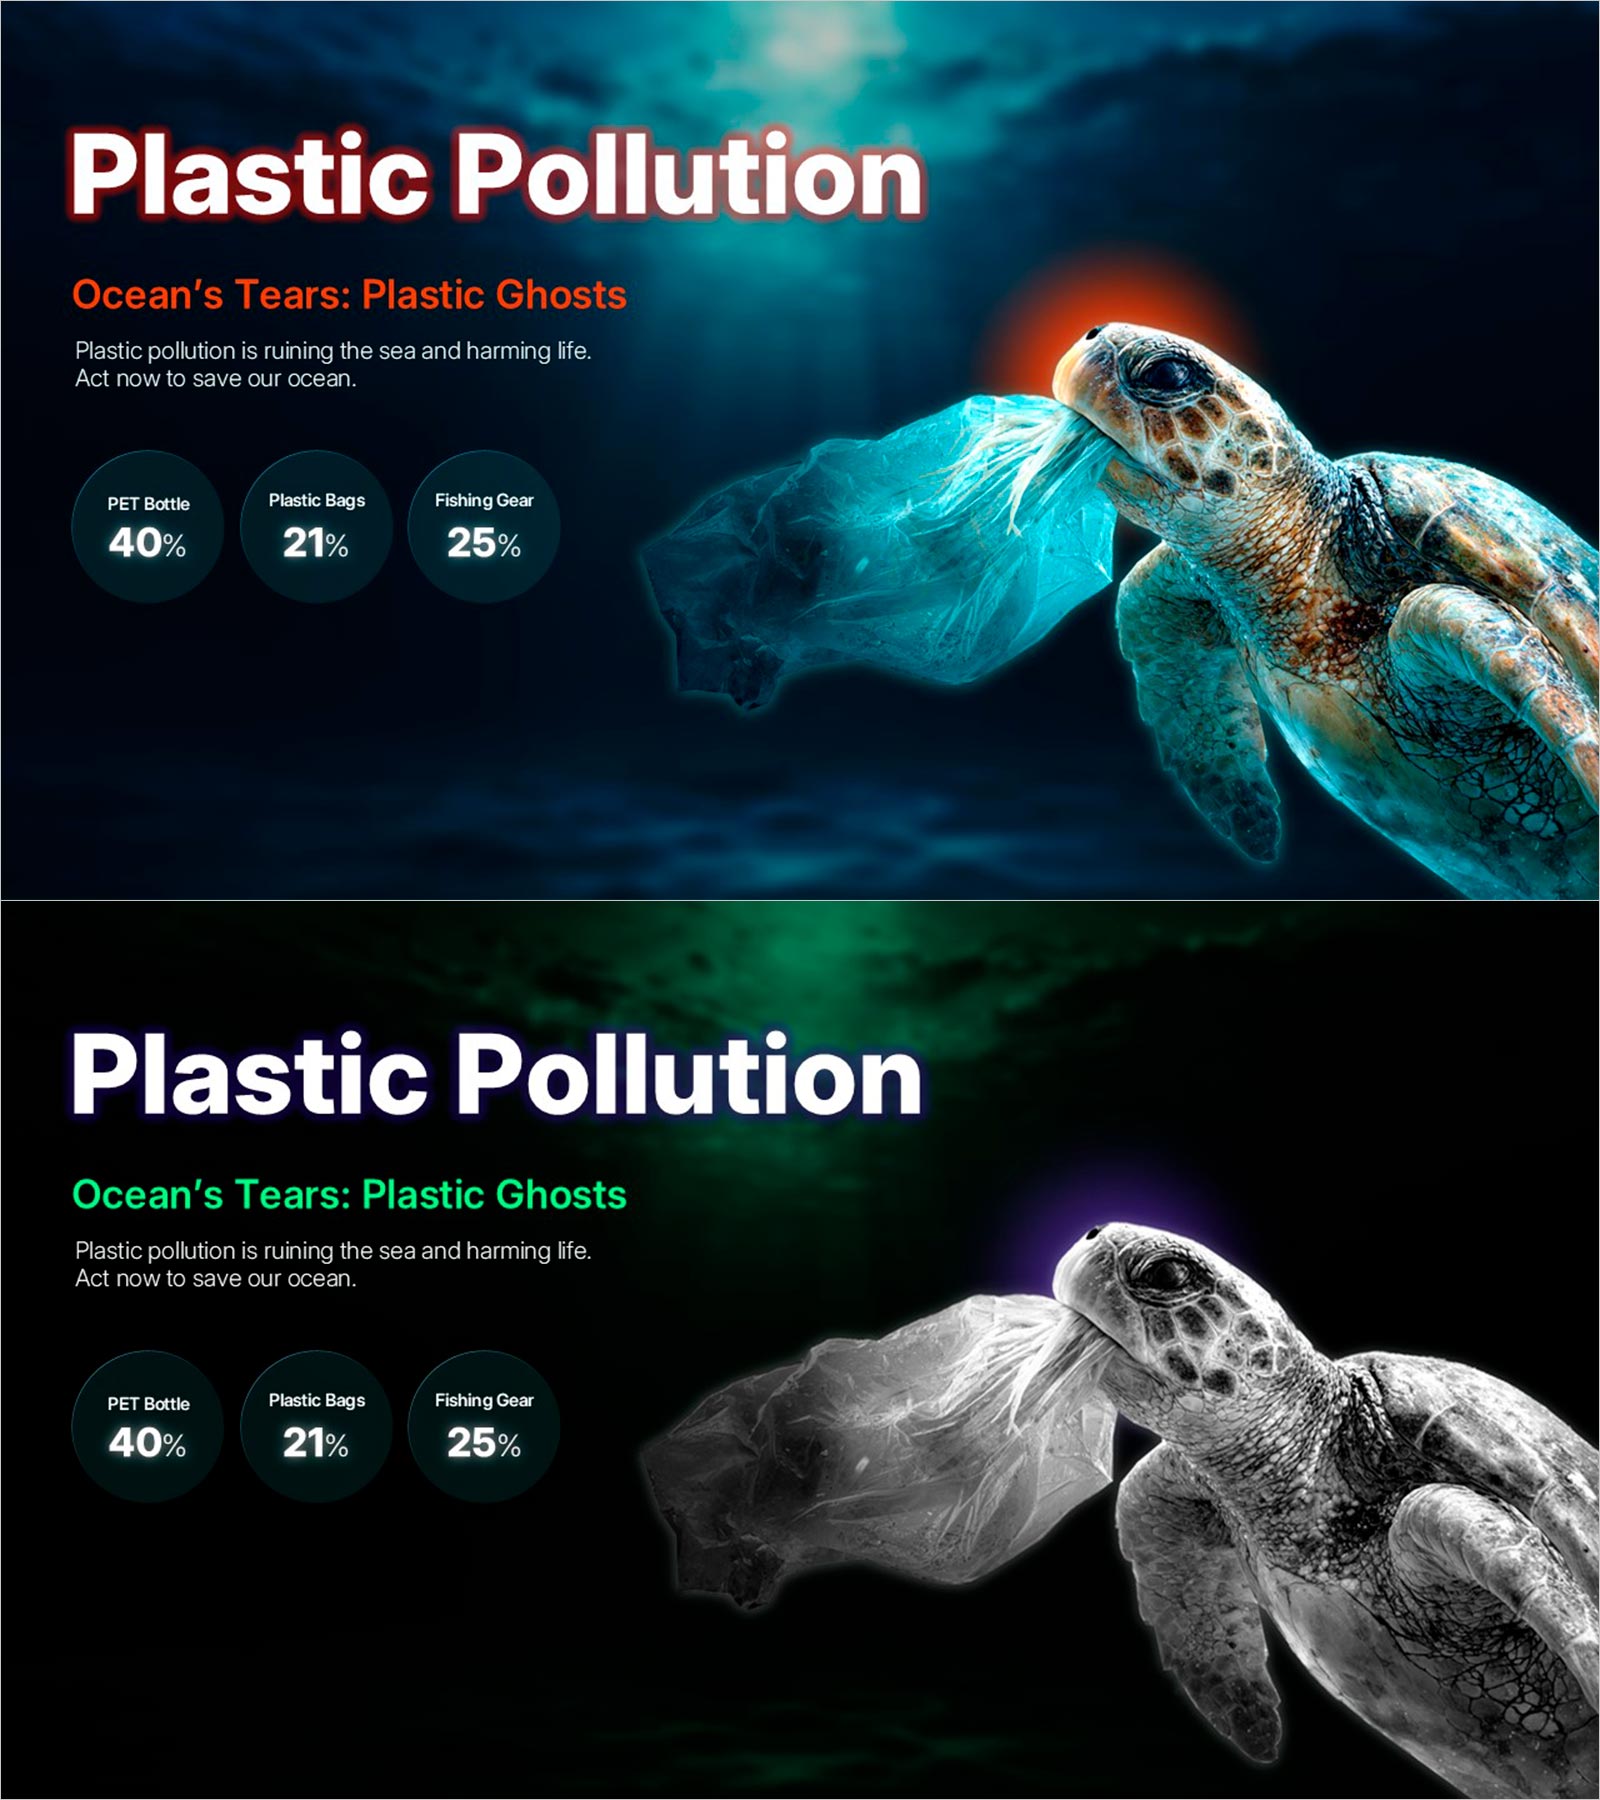
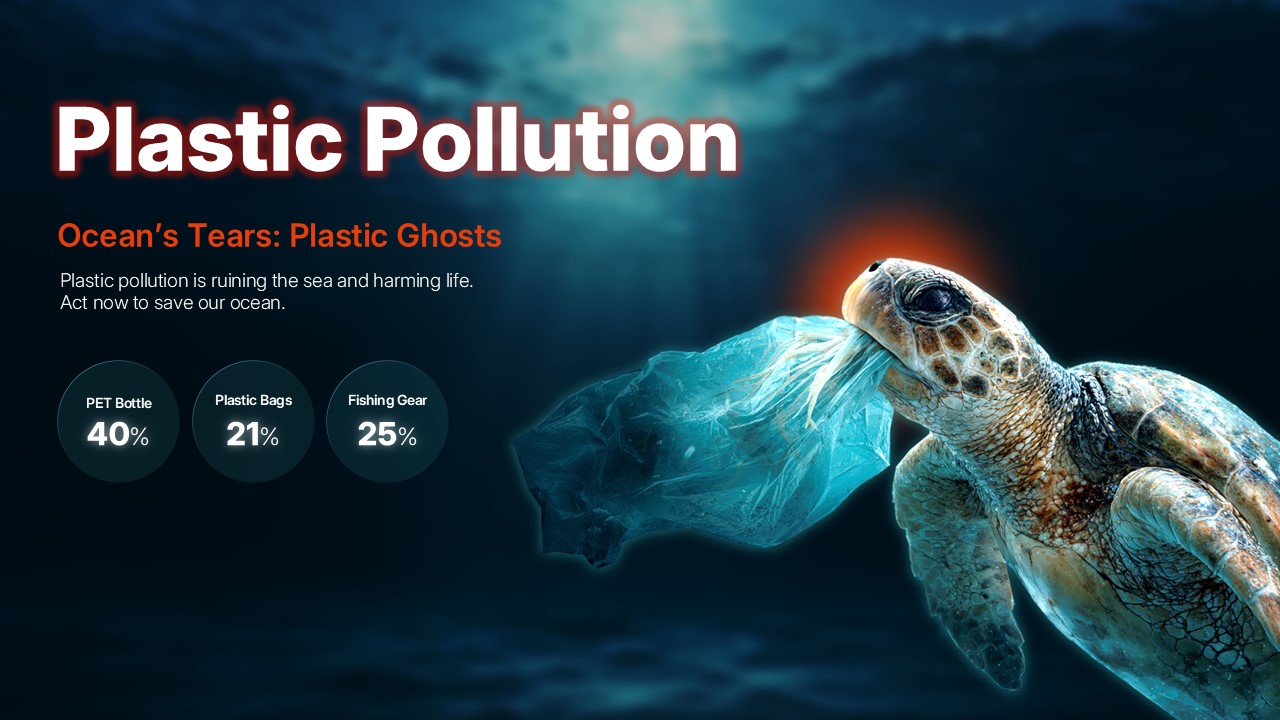
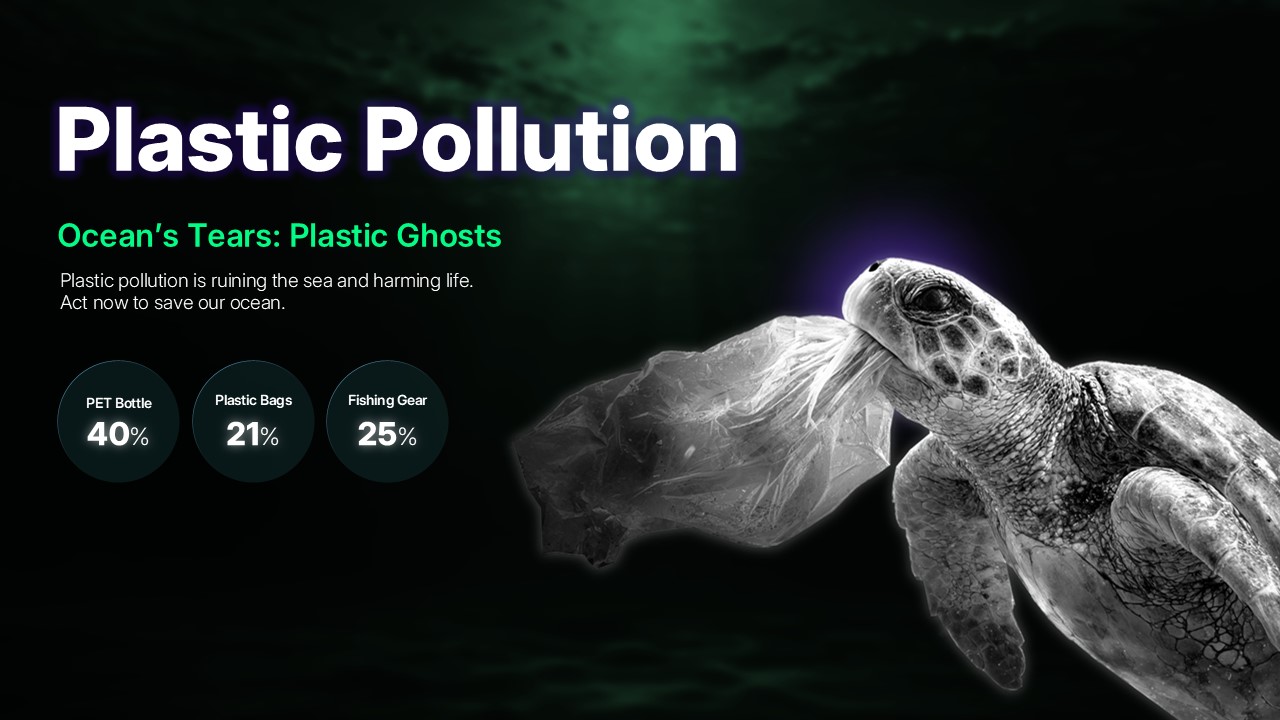
An environmental education PowerPoint slide deck addressing ocean ecosystem destruction caused by plastic pollution. Centered on a striking image of a sea turtle entangled in plastic waste, the layout features a three-part pie chart on the left showing marine debris composition: PET bottles (40%), plastic bags (21%), and fishing gear (25%). The dark blue deep-sea background contrasts with turquoise plastic elements, while the impactful subtitle 'Ocean's Tears: Plastic Ghosts' conveys environmental urgency. Formatted in 16:9 widescreen across 2 slides in editable PPTX, this presentation tool combines emotional impact with data-driven messaging for maximum audience engagement.
Usage Points
-
Main Usage
Visually communicate the severity of marine plastic pollution for environmental education and awareness campaigns. By combining real-world imagery of wildlife affected by plastic waste with statistical data, this slide delivers both emotional resonance and factual credibility. Ideal for sustainability initiatives, ocean conservation messaging, and environmental responsibility presentations.
-
How to Use
Deploy as an opening or impact section in environmental education lectures, corporate CSR presentations, sustainability seminars, and ocean protection campaigns. Customize text and chart figures to align with your organization's messaging, and adjust background and accent colors to match brand guidelines. Fully editable in PowerPoint for seamless integration.
-
Recommended For
Environmental educators, NGO advocates, corporate sustainability officers, government policy makers, university instructors, and environmental campaign strategists seeking to persuade audiences of the critical importance of marine ecosystem protection and plastic pollution reduction.
-
Slide Structure
Two-slide layout: Slide 1 features title, subtitle, and dominant turtle imagery; Slide 2 displays three pie charts on the left (PET bottles, plastic bags, fishing gear percentages) paired with turtle imagery on the right. Three text input areas (title, subtitle, description) and three data charts create clear information hierarchy. Dark blue background with white, orange, and turquoise accents provides visual emphasis and professional polish.
Related Products
-

Business Failure Analysis Graph – Essential Tool for Market and Competitor Analysis
#Emotional Messages
-

Wishing you success after setbacks Slide
#Emotional Messages
-

Comparative Analysis of Our Own Competitiveness – Effective Market Analysis Slide
#Emotional Messages
-

Business Competition Template Cover – The Start of Victory
#Emotional Messages
