Free Balance Sheet by Year Slide – Visualizing Financial Performance
RM0500010_26
- Last Update 08/30/2025
- File Size 0.5MB
- # of Slides 2
- File Format PPTX
- Slide Ratio 16:9
- Color
Keywords
About the Product
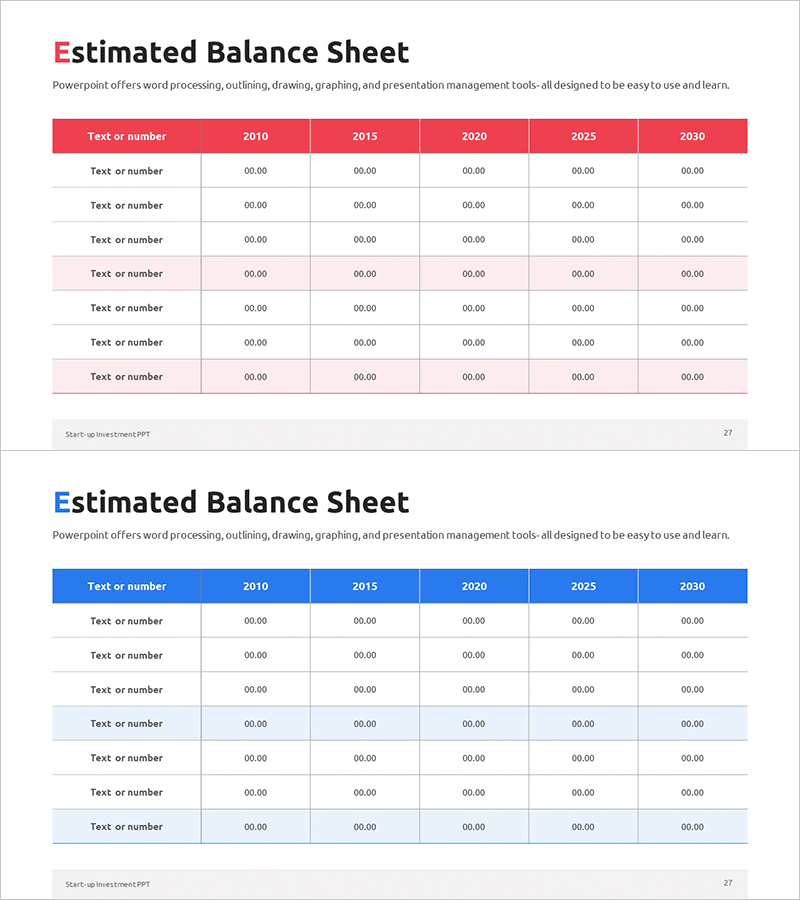
This free PowerPoint slide presents a structured balance sheet table for comparing financial data across multiple years (2010, 2015, 2020, 2025, and 2030). The layout features a 6-column by 8-row table with a bold header row in either red or blue, alternating row shading for improved readability, and 46 editable text and number fields throughout. Two color versions—red and blue—are included in a single PPTX file, allowing you to choose the style that best fits your presentation. The slide is designed for immediate use: simply replace the placeholder text and figures with your actual financial data. It integrates seamlessly into business plan presentations, investor pitch decks, financial reports, and annual review slide decks. For a broader collection of financial slides and presentation templates, explore GoodPello's full library.
Usage Points
-
Main Usage
Designed to present multi-year balance sheet data (2010–2030) in a clear, structured table format for investor presentations, financial reports, and business plan slide decks.
-
How to Use
Replace the year labels, row item names, and numeric values with your actual financial data. Choose between the red or blue color version to match your overall presentation theme.
-
Recommended For
Startup founders, CFOs, financial analysts, IR managers, and anyone who needs to include a structured balance sheet comparison in a PowerPoint presentation or pitch deck.
-
Slide Structure
Single-slide layout with a 6-column × 8-row table diagram featuring 46 editable input fields. Includes two color versions (red and blue) within one PPTX file for flexible use.


