Facility Area Diagram – Visualizing Site and Equipment Status
RJ0900011_14
- Last Update 08/29/2025
- File Size 0.1MB
- # of Slides 2
- File Format PPTX
- Slide Ratio 16:9
- Color
Keywords
- #Content-Based Slides
- #Design-Based Slides
- #Product/Service Introduction
- #Business Introduction
- #Diagram
- #Product/Service Introduction
- #Facilities & Equipment
- #Cluster
- #Spread
- #Closed Cluster Diagram
- #16:9
- #closed-form cluster diagram PowerPoint
- #facility area diagram slide
- #node connection diagram
- #relationship mapping PowerPoint
- #equipment status visualization
- #business facility presentation slide
About the Product
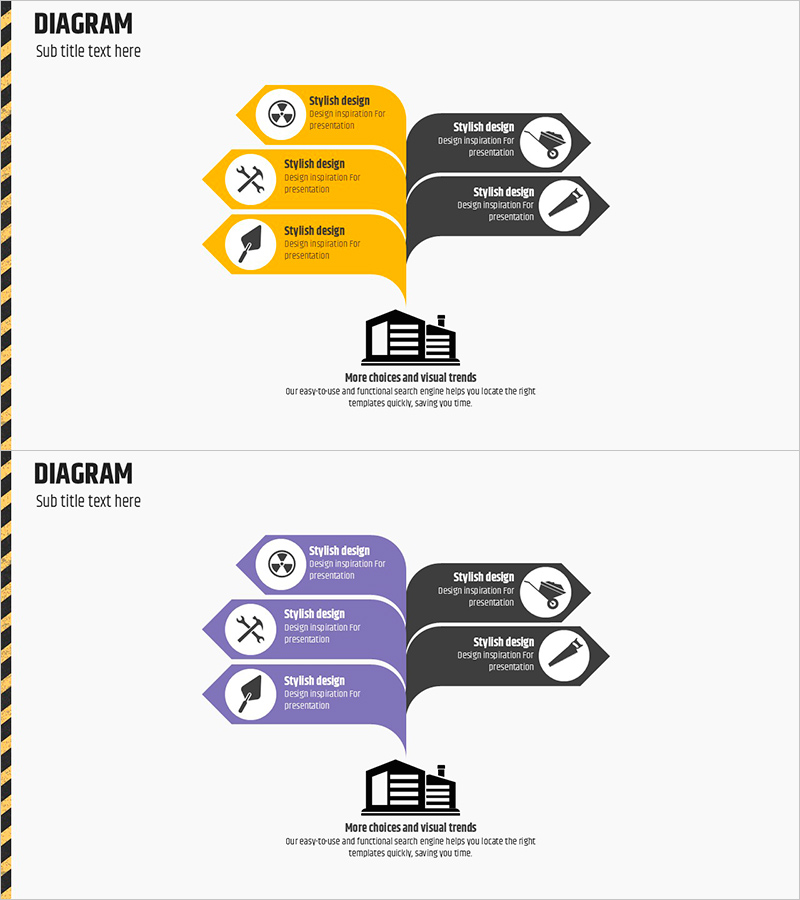
A closed-form cluster diagram PowerPoint slide designed to visualize facility areas and operational status. The layout features three nodes on the left (yellow hexagons) and two nodes on the right (dark gray hexagons) connected by directional arrows, effectively representing relationships between facility zones, functions, and roles. Each node includes an icon placeholder and text area for detailed descriptions of equipment types, operational status, and improvement strategies. Delivered as a 2-slide set in 16:9 widescreen format, the yellow-to-gray color contrast creates clear information hierarchy. Ready for immediate use in facility reports, product presentations, and business status briefings.
Usage Points
-
Main Usage
Represents facility zones, operational functions, and improvement strategies through node-based relationship mapping, transforming complex facility structures into intuitive visual narratives. The left input area (3 nodes) and right outcome area (2 nodes) clearly illustrate cause-and-effect relationships, enabling effective communication of decision-making processes.
-
How to Use
Enter facility names, functions, and responsible departments in each node's text area, and replace icons to indicate categories. Leverage the left-to-right arrow flow to establish logical progressions such as cause→effect, input→output, or current state→improvement plan. Modify colors to differentiate priority levels or operational status.
-
Recommended For
Facility managers, production coordinators, and plant operations teams use this diagram for facility status reports, equipment improvement planning, and process optimization proposals. Ideal for manufacturing, construction, logistics, and energy sector executive briefings, investor presentations, and internal training materials.
-
Slide Structure
2-slide set with consistent layout. Each slide features three left-side nodes (yellow hexagons with icon and text area) and two right-side nodes (dark gray hexagons with icon and text area) connected by directional arrows in a closed-form cluster configuration. Designed in 16:9 widescreen format for compatibility with modern presentation environments.
Related Products
-

Interior Tips for Seniors – Design and Creativity
#Product/Service Introduction #Business Introduction #Diagram
-

Eco-friendly Protection Service Introduction Closed Diagram
#Product/Service Introduction #Business Introduction #Diagram
-

Strategies and Characteristics of Architecture – Clear Expression through Diagrams
#Business Introduction #Diagram #Technological Status
-

Cluster Diagram Visualizing Plans for Each Sporting Activity
#Product/Service Introduction #Marketing Plan and Strategy #Diagram
