Purple Brown Basic Table – Visualization of Financial Plans and Budgets
RJ0800027_25
- Last Update 08/29/2025
- File Size 0.1MB
- # of Slides 2
- File Format PPTX
- Slide Ratio 16:9
- Color
Keywords
About the Product
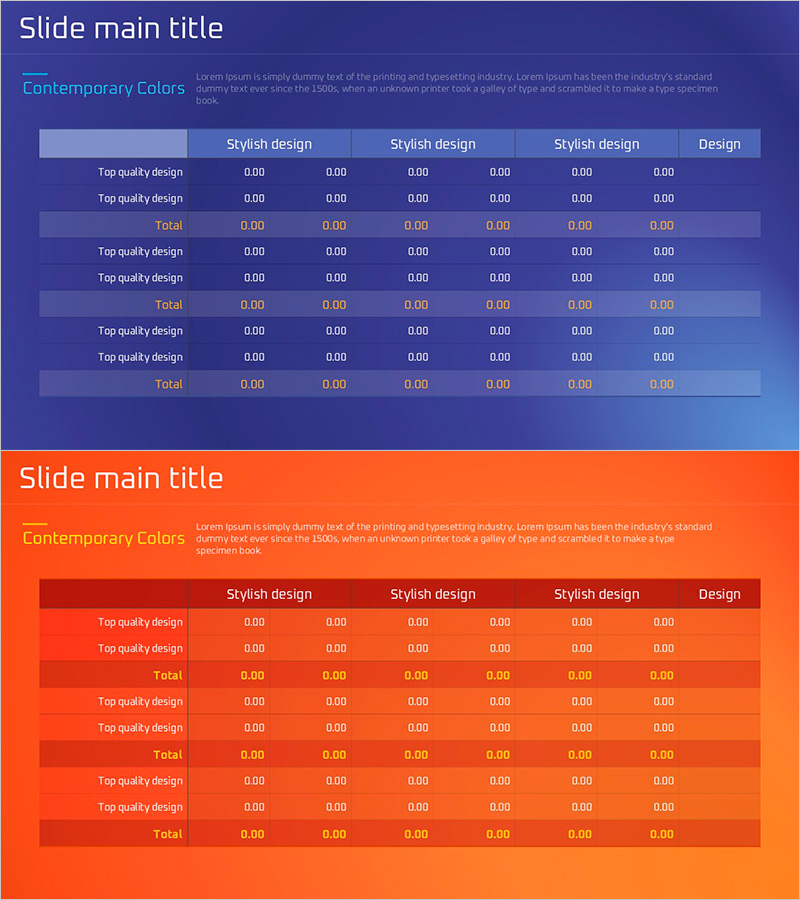
A 2-slide PowerPoint set designed for financial planning and budget visualization. The slides feature a purple and brown dual-tone background with white text and orange-highlighted numerical values to enhance data readability. Each slide contains a table layout with 6 columns and multiple rows, clearly presenting financial metrics, budget items, and cost comparisons. Built with standard PowerPoint table functions for immediate data input, these slides are ideal for financial reports, investment presentations, and budget briefings.
Usage Points
-
Main Usage
Visualize financial plans, budgets, and cost items in table format to clearly communicate numerical data to investors, executives, and stakeholders. Orange-highlighted figures emphasize key metrics and support decision-making.
-
How to Use
Use in investor relations materials, financial reports, budget presentations, and quarterly performance reviews to compare financial metrics, cost structures, and budget versus actual results. Easily add rows and columns for additional data.
-
Recommended For
CFO presentations, financial analysts, executive briefings, investor pitches, financial analysis reports, budget planning meetings, quarterly and annual financial performance reviews, and investment fundraising materials.
-
Slide Structure
2-slide set. Each slide contains a title area plus a 6-column header row with multiple data rows below. The first slide has a purple background while the second features an orange background, allowing section differentiation through color variation.
Related Products
-

The Animals and the Table Chart – Fun in Financial Planning
#Financial Plans and Performance #Diagram #Cash Flow Statement
-

Box Wide Table Template for Financial Planning
#Financial Plans and Performance #Diagram #Cash Flow Statement
-

Effectively Present Financial Performance with Table Charts in Forest Background
#Financial Plans and Performance #Diagram #Cash Flow Statement
-

Check Pattern Template Table – Financial Planning and Budget Management
#Financial Plans and Performance #Diagram #Cash Flow Statement
