Effectively Present Financial Performance with Table Charts in Forest Background
RJ0600094_12
- Last Update 07/16/2025
- File Size 1.4MB
- # of Slides 2
- File Format PPTX
- Slide Ratio 16:9
- Color
Keywords
About the Product
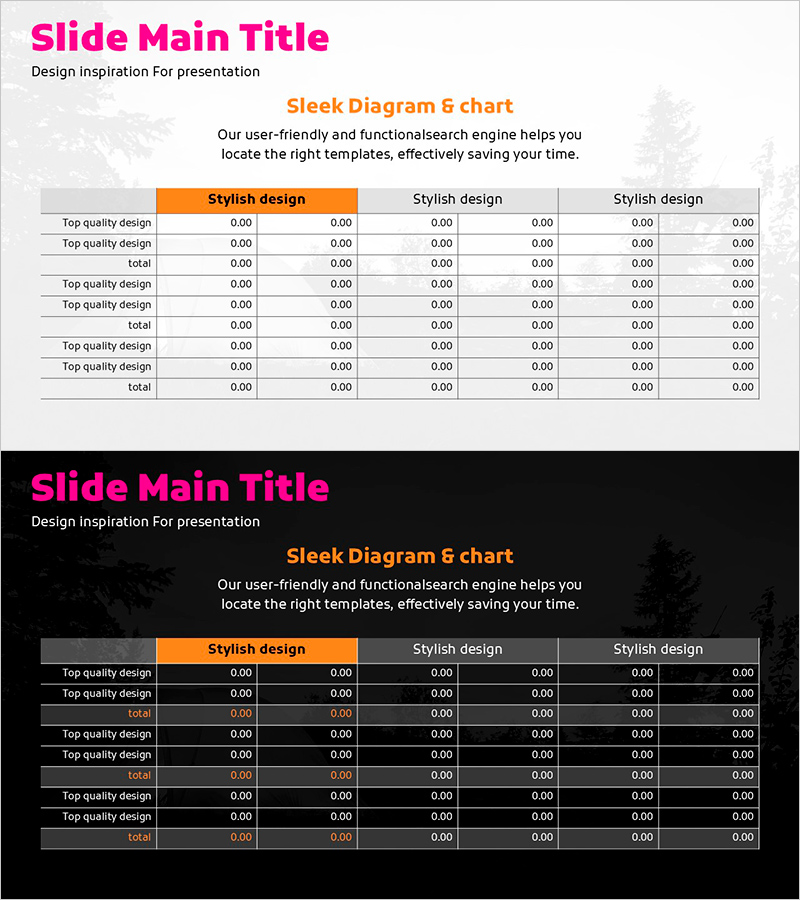
A 3-column data table PowerPoint slide optimized for financial reports and budget planning presentations. The design features an orange header row and gray data rows that create a clear information hierarchy for presenting cash flow statements, revenue analysis, and expense breakdowns. The natural forest background adds credibility to your financial presentation while maintaining readability. The 2-slide set in 16:9 widescreen PPTX format allows you to compare multiple financial datasets side by side. Input fields are clearly defined, making it easy to enter numbers and text for quick slide preparation.
Usage Points
-
Main Usage
Organize and compare financial metrics, budget figures, and cash flow data in a structured row-and-column format. The orange header row draws attention to key categories while gray data rows provide clear visual separation for easy reading and analysis.
-
How to Use
Use in financial reports, quarterly earnings presentations, budget review meetings, and investor briefings to display revenue, expenses, profit margins, and other financial indicators. Simply enter your data into each cell and adjust colors if needed to highlight specific metrics or trends.
-
Recommended For
CFOs, finance managers, accounting teams, executives, and investment professionals preparing quarterly reports, budget planning sessions, and financial analysis presentations. Ideal for data-driven decision-making meetings and stakeholder communications.
-
Slide Structure
2-slide set with each slide containing a data table featuring 3 columns (including orange Stylish design header) and 8-9 rows. The orange header row sits at the top with gray background data entry areas clearly defined below. Forest background imagery spans the entire slide for visual consistency.
Related Products
-

Check Pattern Template Table – Financial Planning and Budget Management
#Financial Plans and Performance #Diagram #Cash Flow Statement
-

The Animals and the Table Chart – Fun in Financial Planning
#Financial Plans and Performance #Diagram #Cash Flow Statement
-

Box Wide Table Template for Financial Planning
#Financial Plans and Performance #Diagram #Cash Flow Statement
-

Ticket Illustration Table – Visualizing Budget Planning
#Financial Plans and Performance #Diagram #Capital Requirements
