Visualizing Value Relationships with Pie Diagram – Business Insights
RJ0700024_11
- Last Update 08/29/2025
- File Size 3.2MB
- # of Slides 2
- File Format PPTX
- Slide Ratio 16:9
- Color
Keywords
- #Content-Based Slides
- #Design-Based Slides
- #Company Introduction
- #Business Introduction
- #Diagram
- #Business Areas
- #Business Areas
- #Spread
- #Centralized Diagram
- #16:9
- #pie diagram PowerPoint
- #3-segment circular chart slide
- #value relationship visualization
- #business insights presentation
- #universe background diagram PowerPoint slide
About the Product
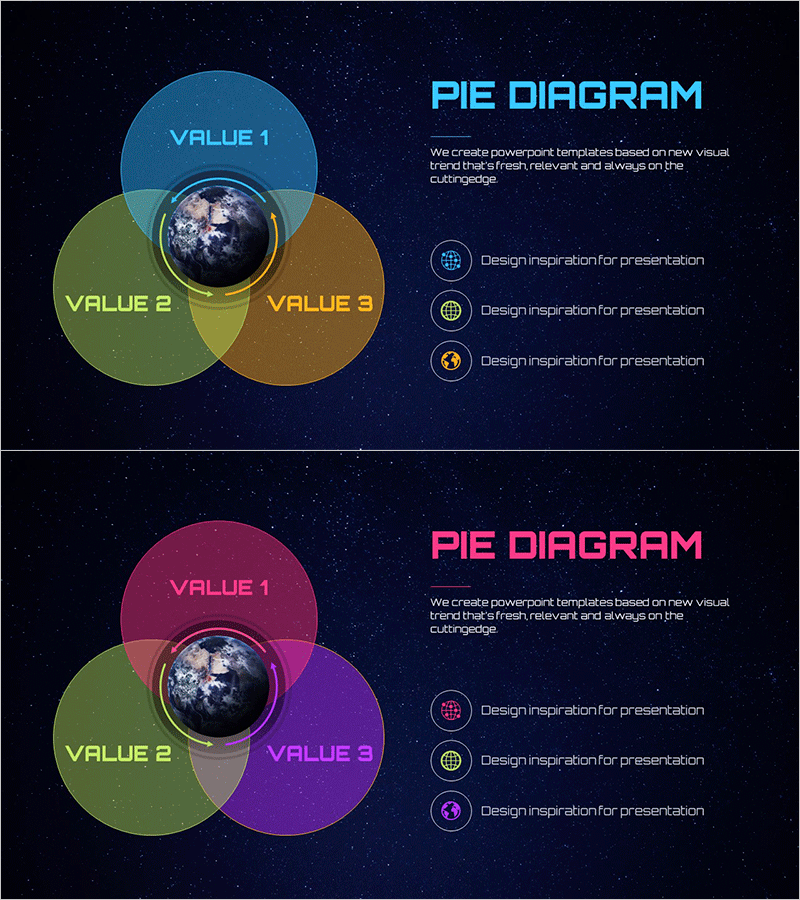
A dark-themed PowerPoint slide featuring a cosmic starfield background that visualizes value relationships across three segments. The design centers on an Earth image surrounded by three overlapping circular areas in blue, green, and brown tones, each labeled with editable VALUE 1, 2, and 3 fields. The right side displays three icon placeholders with accompanying text areas for detailed descriptions. This two-slide set includes a color variation with pink, green, and purple segments, making it ideal for business strategy presentations, market analysis, and competitive positioning discussions.
Usage Points
-
Main Usage
Designed to express three-way relationships, proportions, and influence dynamics centered on a focal point. Effectively communicates business strategy, market segmentation, organizational roles, and product positioning in a single visual.
-
How to Use
Replace VALUE 1, 2, and 3 labels with your own category names. Edit the three icon placeholders and accompanying text descriptions to match your content. The cosmic background and central Earth image remain fixed. Duplicate the color variation slide to represent multiple concepts throughout your presentation.
-
Recommended For
Ideal for executives, strategy teams, marketing professionals, and consultants presenting business models, competitive analysis, and customer segmentation. Effective in investor presentations, strategic planning meetings, and product launch events where complex relationships require intuitive visual communication.
-
Slide Structure
Two-slide set. Each slide features a centered Earth image surrounded by three overlapping circular segments forming a pie diagram, with three icon placeholders and text input areas on the right. Slide 1 uses blue, green, and brown color palette; Slide 2 features pink, green, and purple tones for visual variety.
Related Products
-

Vaccine Diffusion Diagram – Business Introduction and Diffusion Strategy
#Company Introduction #Business Introduction #Diagram
-

Infographic Slide Visualizing Collaborative Business Areas
#Company Introduction #Business Introduction #Diagram
-

Breakthrough Idea Diagram – Business Introduction
#Company Introduction #Business Introduction #Diagram
-

Astronomy Earth Diagram PowerPoint – Visual Exploration
#Company Introduction #Business Introduction #Diagram
