System Education Infographic Connection Elements – Integrating Business and Education
RJ0500012_8
- Last Update 08/27/2025
- File Size 0.6MB
- # of Slides 2
- File Format PPTX
- Slide Ratio 16:9
- Color
Keywords
- #Content-Based Slides
- #Design-Based Slides
- #Business Introduction
- #Technical Approach
- #Diagram
- #Infrastructure
- #System Architecture Diagram
- #Spread
- #Centralized Diagram
- #16:9
- #radial diagram PowerPoint
- #brain-centered infographic slide
- #icon connection diagram
- #business system visualization
- #educational process PPT slide
About the Product
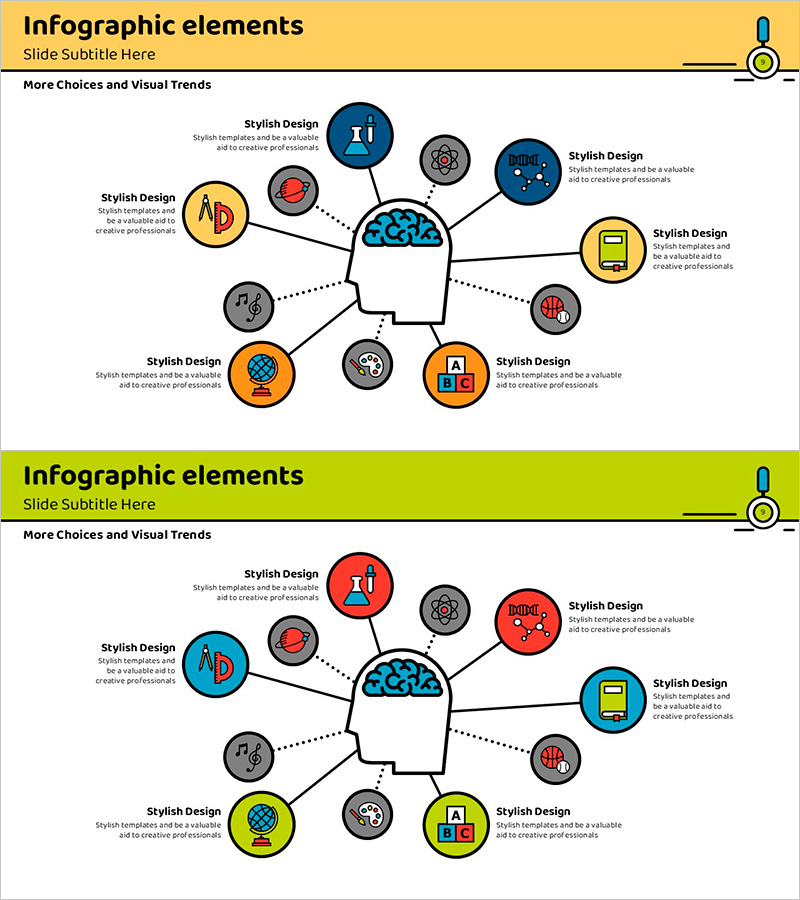
A radial infographic PowerPoint slide that visualizes business, education, and technology concepts through a brain-centered diagram. Eight topics (AI, Marketing, Finance, Technology, Mobile, Education, Analytics, Collaboration) are connected in a circular pattern from the central brain icon, with each node represented by a colored circular badge and icon. The design combines yellow, blue, orange, and gray tones with solid and dotted connector lines to clearly convey information flow. The 2-slide set (yellow and green background versions) is ready to use for system education presentations, organizational structure mapping, business process visualization, and competency framework discussions.
Usage Points
-
Main Usage
Represents organizational core competencies, business systems, and educational processes through a radiating structure from a central concept. The brain-centered radial layout intuitively conveys the interconnectedness of cognitive abilities, learning frameworks, and technology ecosystems, making it effective for executive strategy presentations, educational leadership, and planning team communications.
-
How to Use
Slide 1 (yellow background) works for bright-toned presentation openings and positive messaging, while Slide 2 (green background) suits growth and sustainability themes. Customize each node's icon and text with your organization's actual department names, competencies, or technology elements to create a tailored system map.
-
Recommended For
Recommended for executives, HR teams, educational institutions, IT departments, consultants, and marketing teams explaining organizational structure, competency frameworks, technology roadmaps, and learning ecosystems. Particularly suited for integrated business-education strategy presentations, digital transformation initiatives, and organizational capability enhancement program proposals.
-
Slide Structure
Eight colored circular nodes with icons are arranged in a circular pattern around a central brain icon, connected by solid and dotted lines. Each node includes an independent text area for adding topic names and descriptions. The background colors (yellow/green) and node colors (blue, orange, gray) create visual hierarchy and contrast.
Related Products
-

IoT System Configuration Diagram – Innovation Through Connection
#Business Introduction #Technical Approach #Diagram
-

Centralized Diagram Template for Network-Based App Infrastructure
#Business Introduction #Technical Approach #Diagram
-

System Infrastructure Structure Diagram Slide
#Business Introduction #Technical Approach #Diagram
-

Medical Business Area Diffusion Diagram – Connection and Cluster
#Business Introduction #Diagram #Infrastructure
