Overseas Market Product Sales Statement – Capturing Key Data for Global Markets
RJ0900034_7
- Last Update 08/26/2025
- File Size 0.6MB
- # of Slides 2
- File Format PPTX
- Slide Ratio 16:9
- Color
Keywords
- #Content-Based Slides
- #Design-Based Slides
- #Company Introduction
- #Market and Competitor Analysis
- #Diagram
- #Global Network
- #Target Market
- #Spread
- #Table
- #Centralized Diagram
- #Standard Table
- #16:9
- #global sales table PowerPoint
- #overseas market data table slide
- #product sales comparison presentation
- #country-by-country sales report PPT
- #data table slide template
- #international market analysis PowerPoint
About the Product
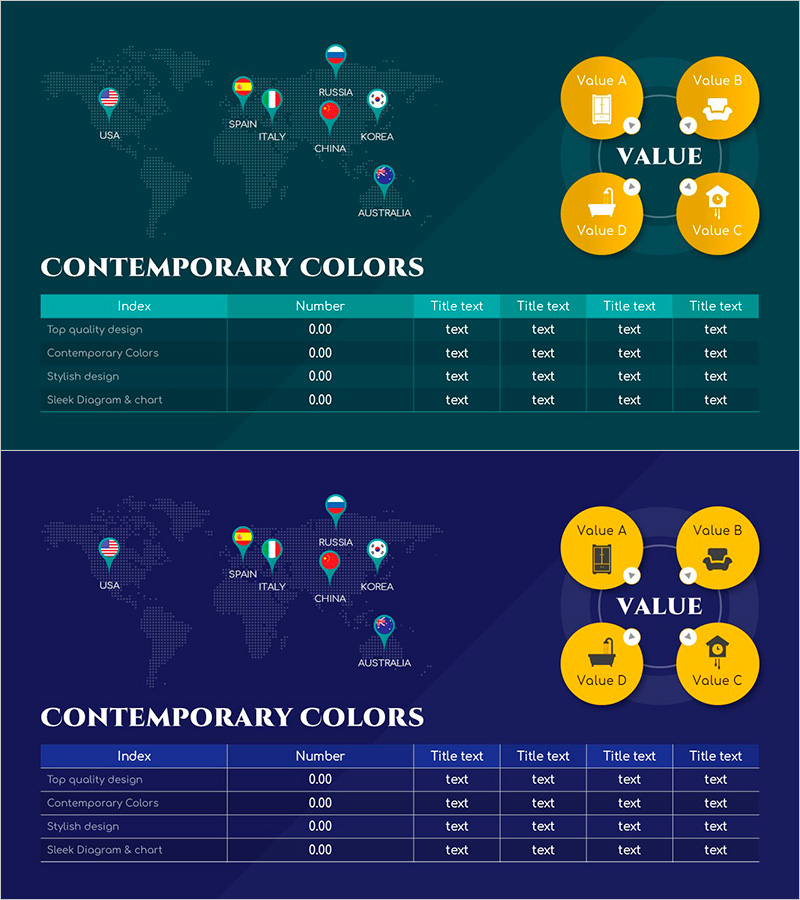
A six-column table structure PowerPoint slide designed to organize overseas market product sales data systematically. The layout features a teal background with white typography for high-contrast readability and optimal data visibility. The left-side vertical index area and right-side data entry section are clearly separated, making it ideal for comparing sales by country, region, or product category. The two-slide set provides both teal and navy tone versions, allowing you to match your presentation's color scheme. World map icons and country pin markers reinforce the global network context, while circular icon elements create visual hierarchy and enhance information structure.
Usage Points
-
Main Usage
Communicates overseas market expansion status, country-by-country or regional product sales figures, and global sales performance with clear numerical data. Ideal for investor presentations, executive reports, and marketing strategy meetings where international market data needs systematic visualization.
-
How to Use
Enter country names, region names, or product categories in the left index row, then input sales figures, growth rates, or market share percentages in the right data columns. Use the teal tone version for presentations emphasizing reliability and stability, and the navy tone for meetings requiring professional and premium positioning. The world map and pin markers visually reinforce global expansion context.
-
Recommended For
International business managers, export-import company executives, global marketing teams, investor relations (IR) professionals, and overseas branch performance reporting staff. Suitable for multinational corporations' quarterly or annual results presentations and new market entry strategy documents.
-
Slide Structure
Two-slide set. Each slide features a world map with country pin markers at the top, a central cluster of four circular VALUE icons, and a 6-column data table at the bottom (Index, Number, and four Title text columns). The table includes four data rows (Top quality design, Contemporary Colors, Stylish design, Sleek Diagram & chart) with editable cells for numerical and text input.
Related Products
-

Target Market Analysis by Region – Global Marketing Strategy
#Company Introduction #Market and Competitor Analysis #Diagram
-

Global Network World Map – Target Market Analysis
#Company Introduction #Market and Competitor Analysis #Diagram
-

Global Market Analysis – Global Network and Target Market
#Company Introduction #Market and Competitor Analysis #Diagram
-

List of Global Target Countries – Market Entry Strategy
#Company Introduction #Market and Competitor Analysis #Other
