Green-Yellow Schedule – Ideal Slide for Strategic Business Planning
RJ0900026_29
- Last Update 08/24/2025
- File Size 0.6MB
- # of Slides 2
- File Format PPTX
- Slide Ratio 16:9
- Color
Keywords
About the Product
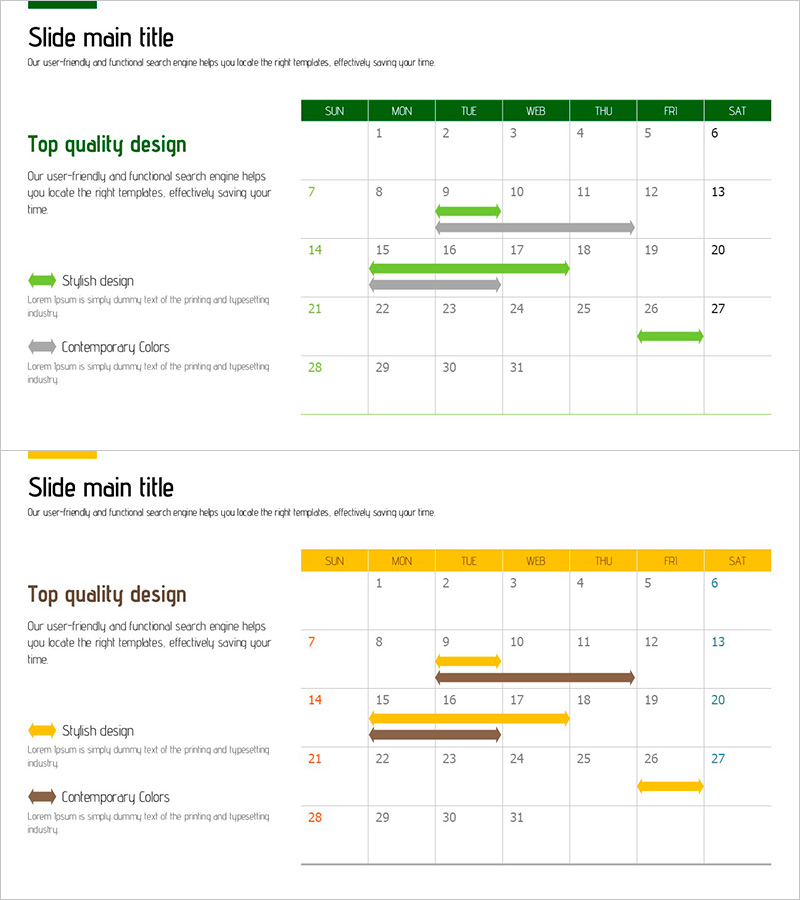
A Gantt chart-style PowerPoint slide designed for business project planning and timeline management. The horizontal bar chart uses green and yellow colors to distinguish different task phases, with a weekly grid layout featuring day-of-week headers (SUN to SAT) and date cells (1-31). Each project task is represented by an arrow-shaped bar indicating its start date and duration, enabling clear visualization of the overall project timeline. Provided in 16:9 PPTX format, this slide template allows you to freely edit text and colors for immediate use in various business planning presentations and strategic planning meetings.
Usage Points
-
Main Usage
This Gantt chart slide visualizes project schedules and business planning timelines. Horizontal bars represent each task's duration across a weekly grid, allowing stakeholders to view the entire project timeline at a glance. Ideal for executive briefings, team meetings, and strategic planning presentations to communicate project progress and scheduling clearly.
-
How to Use
Replace task names (Stylish design, Contemporary Colors, etc.) with your actual project task names. Adjust the start position and length of green and yellow bars to match your real schedule. Keep the day headers and date grid fixed, but customize the legend text and colors to fit your project requirements.
-
Recommended For
Project managers, business planners, executive reporting specialists, marketing team leads, and project leaders in construction and manufacturing sectors. Particularly effective for presenting parallel task execution and multi-phase project progress tracking in weekly or monthly planning scenarios.
-
Slide Structure
Consists of 2 slides, each featuring a horizontal Gantt chart with 7 day-of-week headers (SUN–SAT) and a 4-week date grid (1–31). Four task items are listed on the left side, with green or yellow bars on the right grid indicating each task's duration. A legend at the bottom left explains the color coding for task phases.
Related Products
-

Weekly Timeline Strategy – Visualizing Business Plans
#Business Strategy #Business Management #Diagram
-

Monthly Planner Slide – Efficient Business Strategy
#Business Strategy #Business Management #Diagram
-

AI Implementation Roadmap PowerPoint Slide – 12-Week Matrix
#Business Strategy #Business Management #Operational Plan
-

Simple Business Roadmap – Business Strategy
#Business Strategy #Business Management #Diagram
