Business Operation Schedule – Efficient Operation Strategy
RM0100001_20
- Last Update 01/24/2025
- File Size 2MB
- # of Slides 2
- File Format PPTX
- Slide Ratio 16:9
- Color
Keywords
About the Product
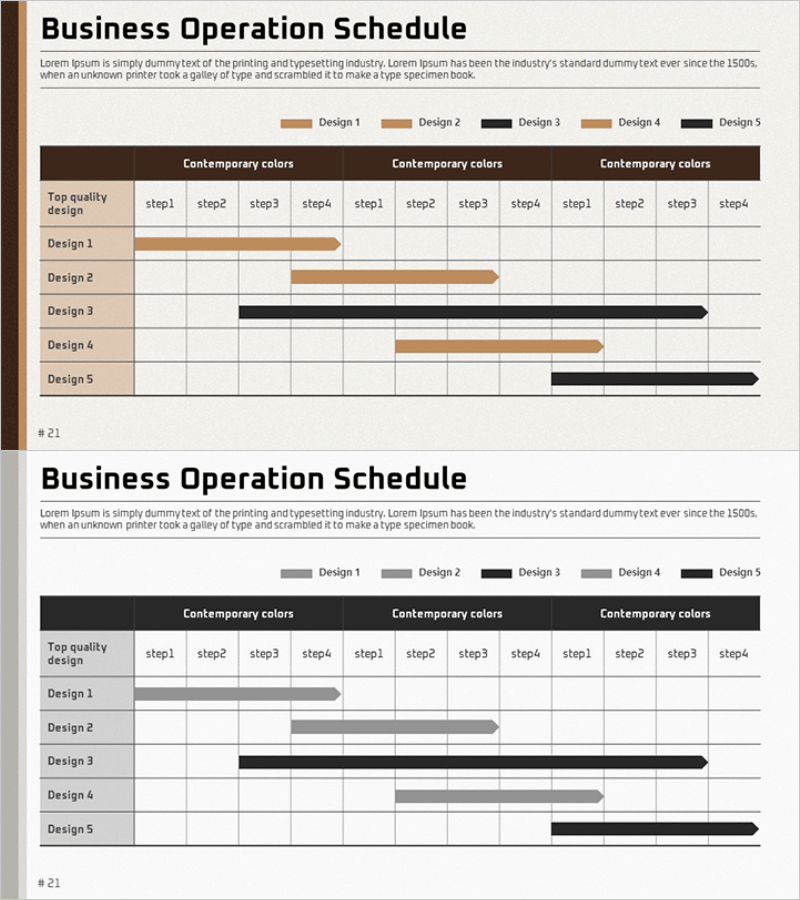
A professional business operation schedule PowerPoint slide featuring five design variations with Gantt chart timeline structure. This presentation template visualizes project phases, duration of each stage, and parallel tasks in a single view. Available in multiple color schemes including brown, gray, and black tones that can be customized to match your corporate branding. Ideal for business plans, operational reports, and strategic presentations. Optimized for 16:9 widescreen format to ensure compatibility with modern presentation environments.
Usage Points
-
Main Usage
This slide visualizes business operation schedules and project phases using a Gantt chart format. Each design option displays five stages of work duration in a parallel structure, clearly communicating the overall project timeline. Enhances credibility of execution schedules in business plans, operational strategy presentations, and investor briefings.
-
How to Use
Enter work items corresponding to each row (Design 1-5) and adjust the Gantt bar length and start point according to your project timeline. Modify the top columns (step1-step4) to reflect your organization's time units such as months, quarters, or years. Use the color legend to distinguish task priorities or departmental responsibilities.
-
Recommended For
Recommended for business plans, operational strategy reports, project management presentations, investor pitches, and quarterly or annual operational planning meetings. Ideal for executives, project managers, business development teams, and operations managers explaining organizational execution timelines to stakeholders.
-
Slide Structure
Two-slide set featuring brown-toned design variations on the first slide and gray/black-toned options on the second. Each slide contains a 5-row by 4-column Gantt chart structure (Design 1-5 rows, step1-step4 columns) with 20 text input areas optimized for timeline data entry and project phase visualization.
Related Products
-

Newspaper Wide PowerPoint Template Schedule – Business Strategy
#Business Strategy #Operational Plan #Diagram
-

Work Progress Schedule – Systematic and Stylish Diagram
#Business Strategy #Operational Plan #Diagram
-

Business Promotion Schedule – Roadmap for Business Strategy
#Business Strategy #Operational Plan #Diagram
-

Calendar Business Promotion Schedule – Strategic Roadmap
#Business Strategy #Operational Plan #Diagram
