World Maps and Target Areas – Global Network Visualization
RJ0900019_22
- Last Update 08/21/2025
- File Size 2.6MB
- # of Slides 2
- File Format PPTX
- Slide Ratio 16:9
- Color
Keywords
- #Content-Based Slides
- #Design-Based Slides
- #Company Introduction
- #Business Introduction
- #Diagram
- #Other
- #Global Network
- #Infrastructure
- #Cluster
- #Chain Diagram
- #16:9
- #world map PowerPoint slide
- #global network diagram
- #regional target presentation
- #radial diagram template
- #international business slide
- #map-based PowerPoint template
About the Product
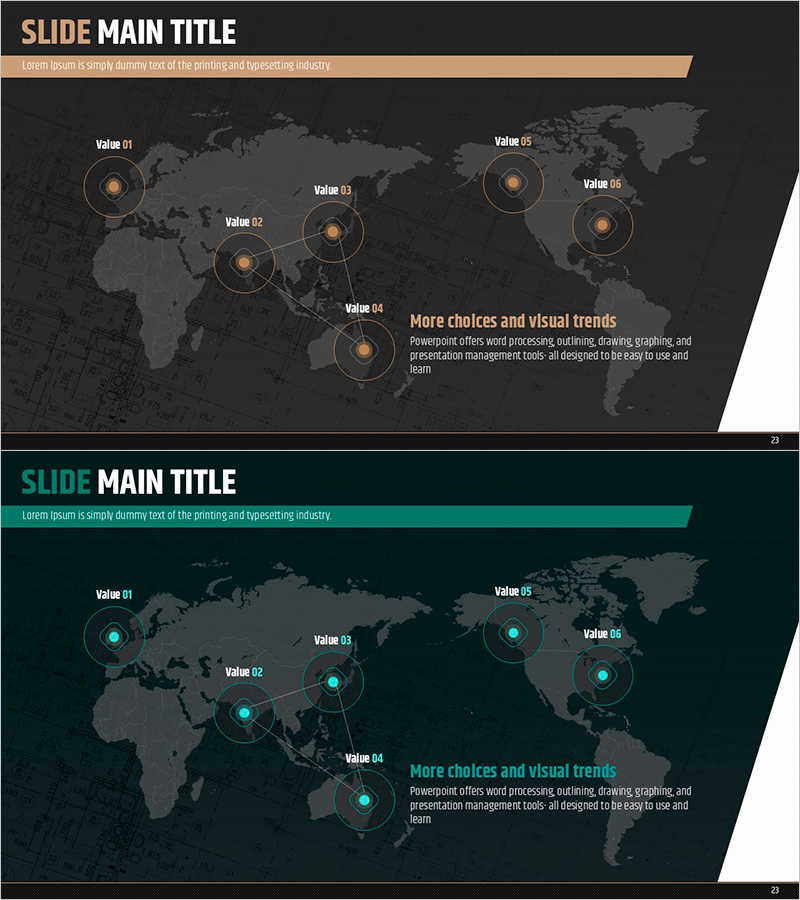
A global network visualization PowerPoint slide featuring a world map background with six key regions connected as radial nodes in circular diagrams. Dark background with gold and cyan accent colors highlights regional target information and comparative data. Optimized for business expansion, international partnerships, and global strategy presentations in a 2-slide composition. Each region's metrics, performance, and plans are displayed at a glance. Delivered in 16:9 widescreen PPTX format, fully editable and ready to customize.
Usage Points
-
Main Usage
Presents global business strategies, international partnership networks, regional target marketing, and overseas branch introductions by combining geographic information with data visualization. Circular nodes positioned on the world map display each region's key metrics, performance, and strategic plans, conveying global-scale business status intuitively.
-
How to Use
Replace node text and figures with your own regional data, and add or remove regions as needed. The dark background with gold and cyan colors can be adjusted to match corporate brand guidelines. Connection lines and icons are fully customizable to fit your presentation style.
-
Recommended For
Global company executives and business development teams, international marketing managers, overseas investment and partnership specialists, consultants, finance and trade professionals, and multinational project leaders presenting regional performance, plans, and network structures.
-
Slide Structure
Slide 1: Title + world map background + 6 radial nodes (Value 01–06) with circular diagrams + connecting lines + emphasis text box. Slide 2: Identical layout with color variation (gold to cyan tone shift). Each node is structured as an editable circular diagram for region name, metrics, and descriptions.
Related Products
-

Building Infrastructure Slide – Efficient Connection and Global Network
#Company Introduction #Business Introduction #Diagram
-

Global Infrastructure Slide – Visualizing Global Networks
#Company Introduction #Business Introduction #Diagram
-

Show Global Routes - Global Network Diagram
#Company Introduction #Business Introduction #Diagram
-

Global Partnership Mediated by Nature – Eco-Friendly Design
#Company Introduction #Business Introduction #Diagram
